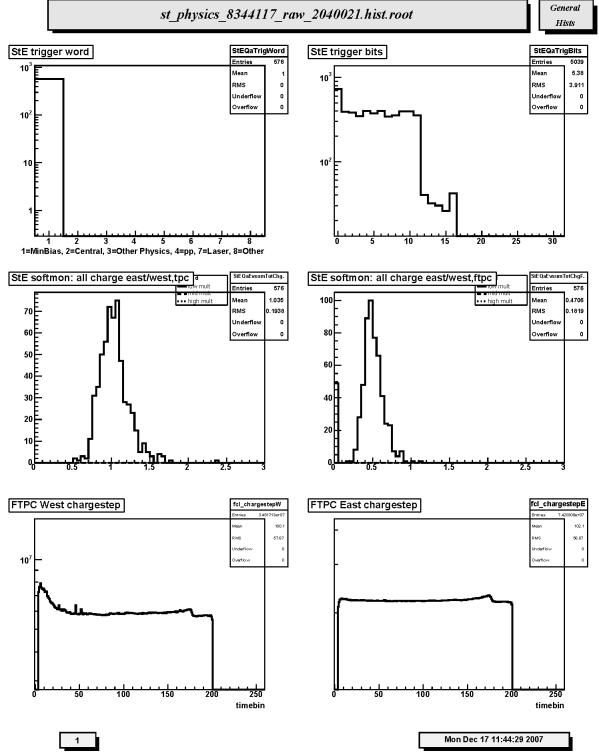
1. StE trigger word: Distribution of trigger word groups: 1 = minimum bias, 2 = central, 3 = other physics, 4 = pp, 5 = high BEMC tower, 7 = laser, 8 = other.
2. StE trigger bits: Frequency of usages of 32 trigger bits.
3. StE softmon: all charge east/west,tpc: Ratio of total charge in all reconstructed clusters in TPC east to west halves. Should be peaked at ~1 with FWHM ~ 0.5.
4. StE softmon: all charge east/west,ftpc: Ratio of total charge in all reconstructed clusters in FTPC East to West. Should be peaked less than 1 for d+Au.
5. FTPC West chargestep: The real chargestep corresponds to the maximum drift time in FTPC West (clusters from inner radius electrode) and is located near 170 timebins. This position will change slightly with atmospheric pressure. The hits beyond the step at timebin 170 are due to electronic noise and pileup. This step should always be visible even if it is only a "blip".
6. FTPC East chargestep: The real chargestep corresponds to the maximum drift time in FTPC East (clusters from inner radius electrode) and is located near 170 timebins. This position will change slightly with atmospheric pressure. The hits beyond the step at timebin 170 are due to electronic noise and pileup. This step should always be visible even if it is only a "blip".