Tracking Pedestals for FermiLab test beam data taken in May of 2007 , based on run May7_run34
Method B: Assume chip peds are describe by linear relation : A+B*stripID . Allow A,B vary event by event
Example of one event: raw (top) , after ped correction (bottom). Plane U (V) spans X-axis 0-191 (192-383).
Vertical green lines mark chip boundaries. Found pedestal per chip is marked be the ~horizontal green line.
(Similar 200 events (PDF) )

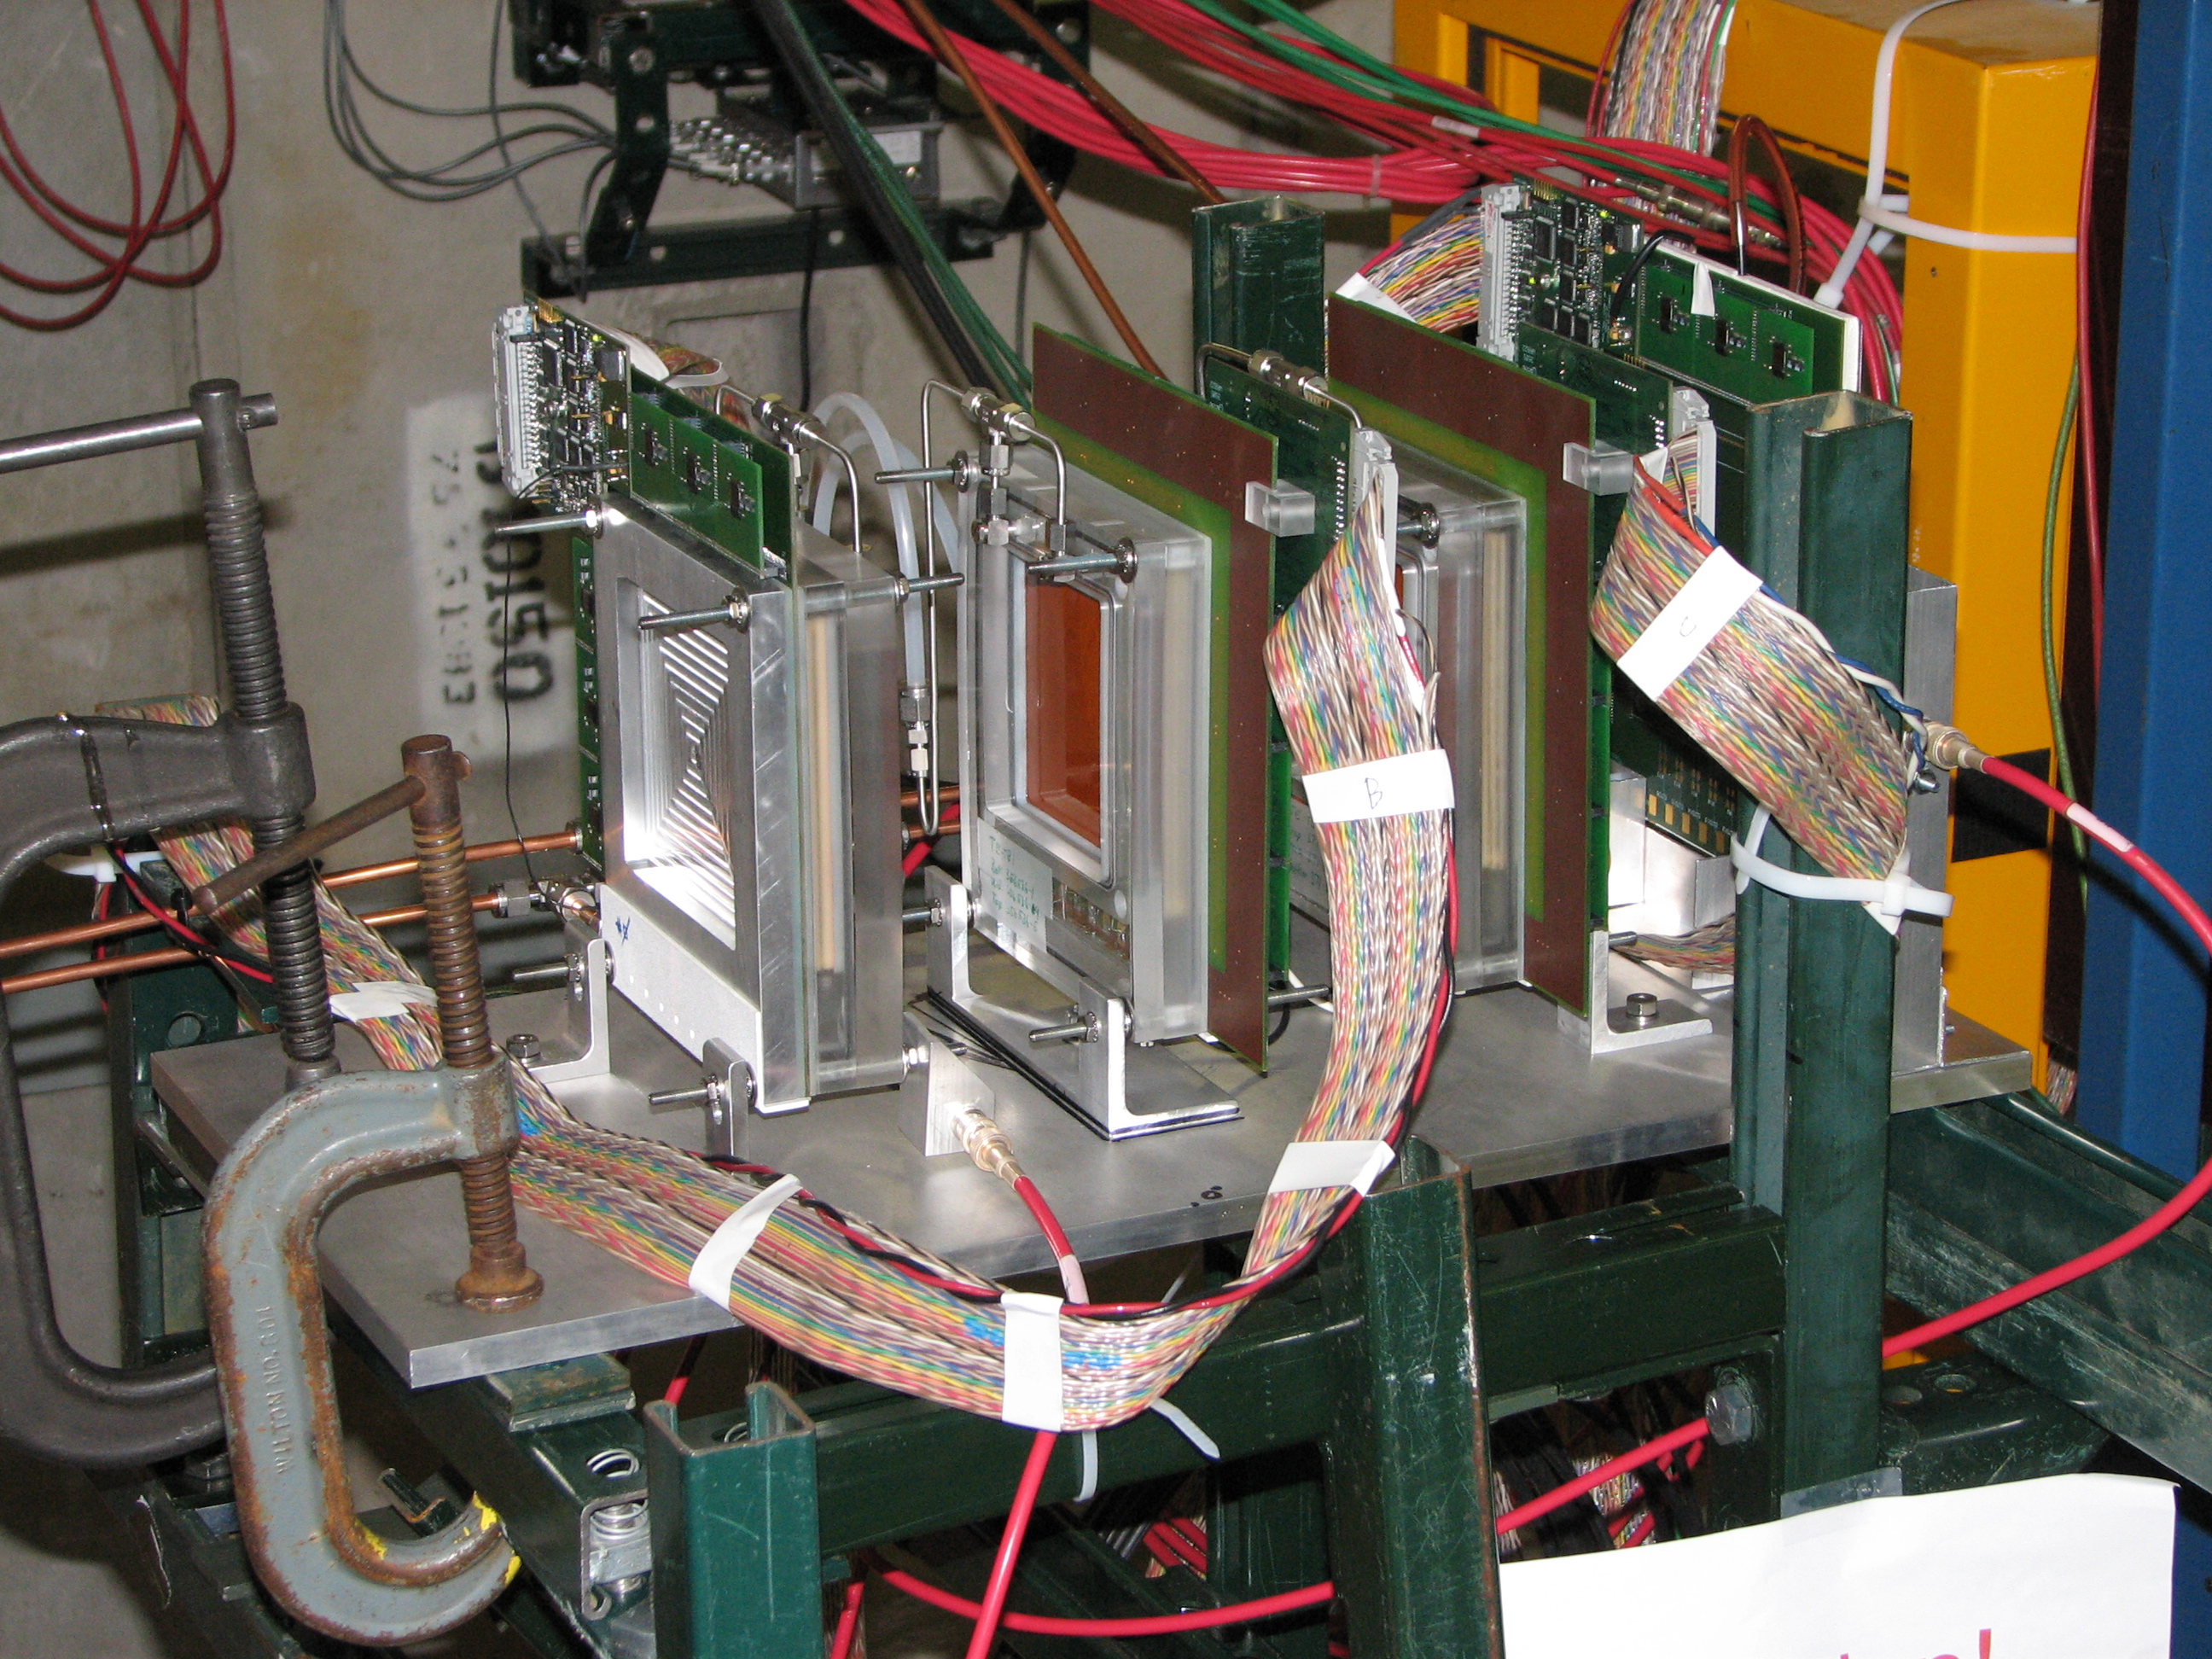
- Detector layout
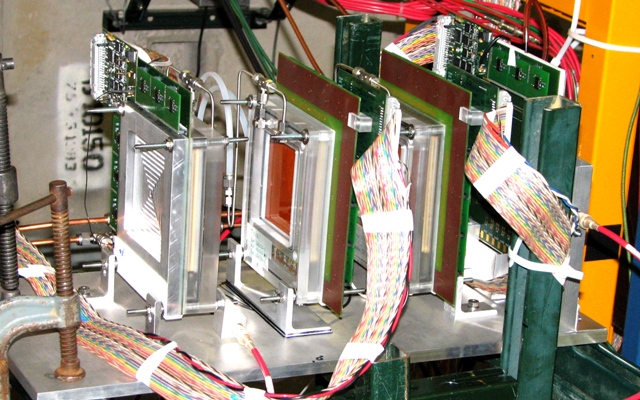 (zom in)
- 3 GEM detectors labeled A,B,C
- 2 strip plains per detector, labeled U & V
- U plane readout by 3 APV chips labeled 0,1,2, total of 192 channels
chip 0: strip0-31 not connected, strip32-63 connected
chip 1: strip64-127 connected
chip 2: strip128-191 connected
- V plane readout by 3 APV labeled 3,4,5 total of 192 channels
chip 3: strip1-63 connected
chip 4: strip64-127 connected
chip 5: strip128-191 dead
- Strip naming scheme: DPnnn, (D=detector, P=plane, nnn=strip), e.g.: BU031
- Example of raw ADC spectra for 3 different strips. Note, signal is below pedestal, overflow is at 0.

- The same channels after pedestal correction procedure described below. Now sign of ADC is reversed so the values grow w/ energy.

- Details of multiple-pass pedestal correction method B.
a) accumulate raw spectra for every strip, find largest pedestal peak, fit gaussion, drop broken strips with too narrow or out of range peak. (see previous version of the pedestal algoA )
b) discard strips at the begin/end of chip - show abnormal pedestal fluctuation.
c) Paramterize ped(stripID)=ped0+tgPed*stripID for every event and every chip using:
- working strips
- drop 10 strips w/ largest ADC (to discard possible signal)
- drop 2 strips w/ smallest ADC (to discard outliers)
- Fit A+B*x formula (assuming sigma of pedestal distribution of 6-12 ADC, based on data)
- QA distribution (impose chi2, A,B range) and discrad whole chip for given event if any QA cut failed
d) accumulate ADC strip spectra corrected for chip_pedestals and determin stip dependent (constant per run) pedestal correction (stripPed).
e) final ADC ~ energy= -( rawADC(eve) - chipPed(eve) -stripPed)
- List of discarded strips and strip pedestal (after chipPed correction)
- Assumed resulution and position of average pedestals for chipPedestal fit.
| chipID | pedSig
ADC | pedMean
ADC
|
| 0 | 6.5 | 550
|
| 1 | 10 | 570
|
| 2 | 12 | 650
|
| 3 | 10 | 640
|
| 4 | 12 | 620
|
| 5 | dead
|
- QA cuts requirements (actual fit formula f(ch)= ped0 + tgPed*(ch-ch0) decouples slope from the constant )
* chi2/dof in [0.05,2.0]
* |ped0-pedMean| <100 ADC counts
* tgPed in [-0.5,1.5]
- distribution of chi2/DOF (before cut) for all 5 disk

- distribution of ped0 (before cut) for all 5 disk

- distribution of tgPed (before cut) for all 5 disk

- Distribution of strip pedestals position (top) & width (bottom) _after_ chipPed subtraction and _before_ stripPed correction. (plots for all strips ) Dead strips are red.

- Distribution of strip pedestals after both chipPed & stripPed correction: plots for all strips
- Used code is here
 (zom in)