This document describes the calibration currently known as "set450b" in the TestScheme_emc database. -- WARNING: I'm in the middle of updating the page...
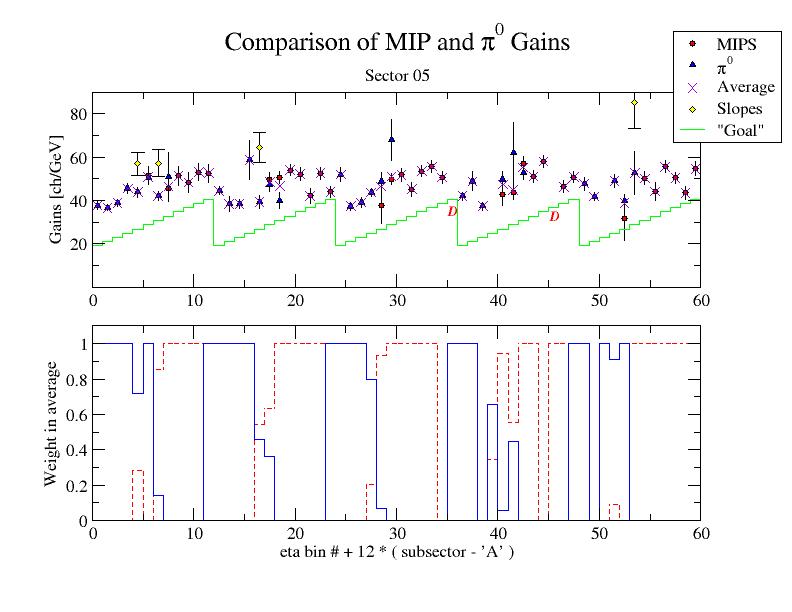
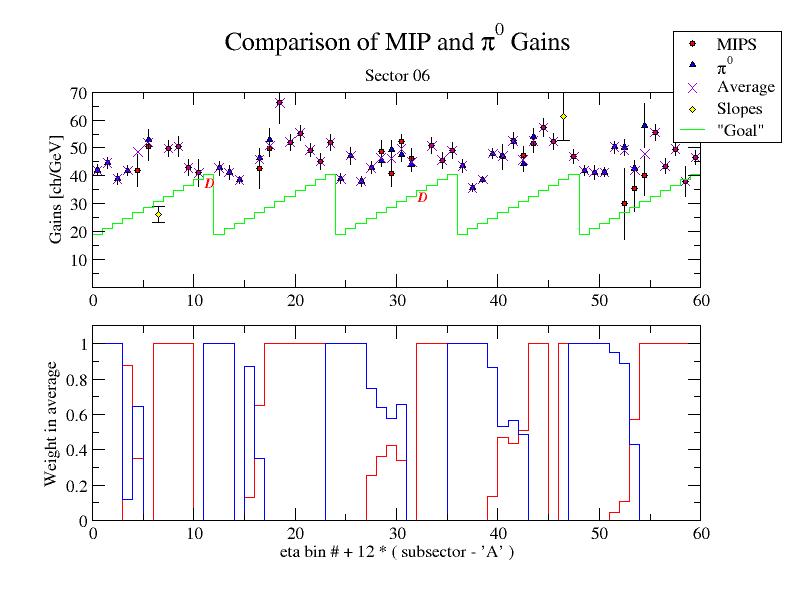
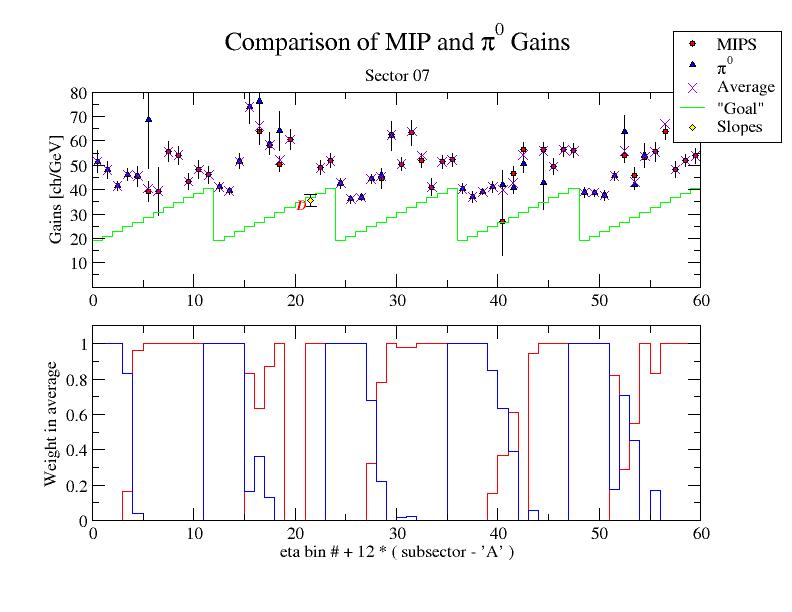
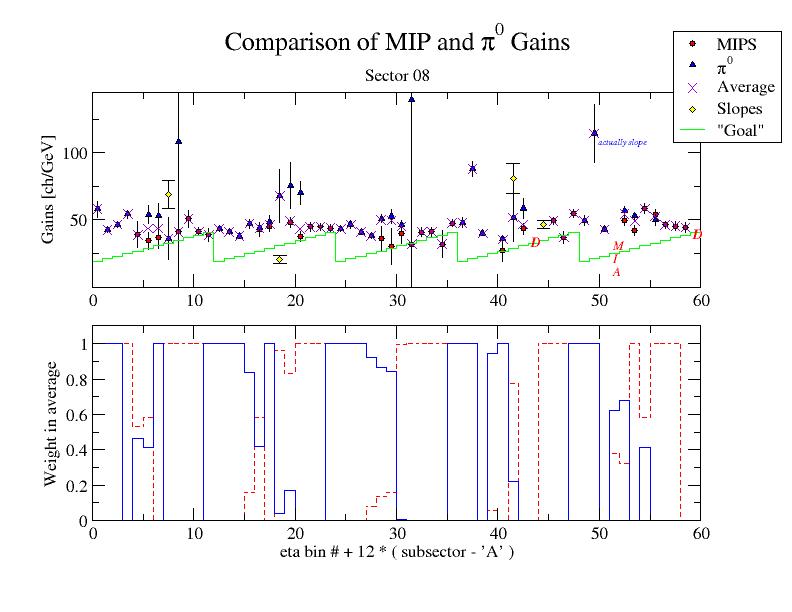
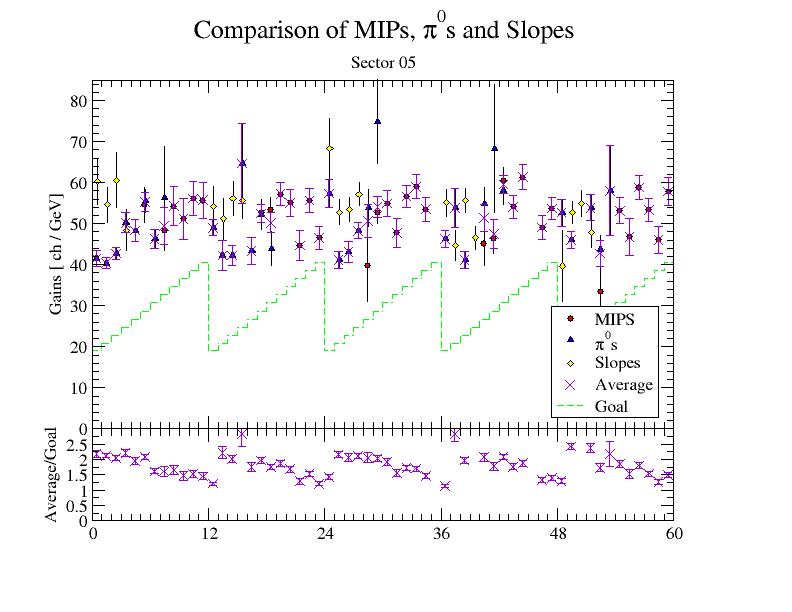
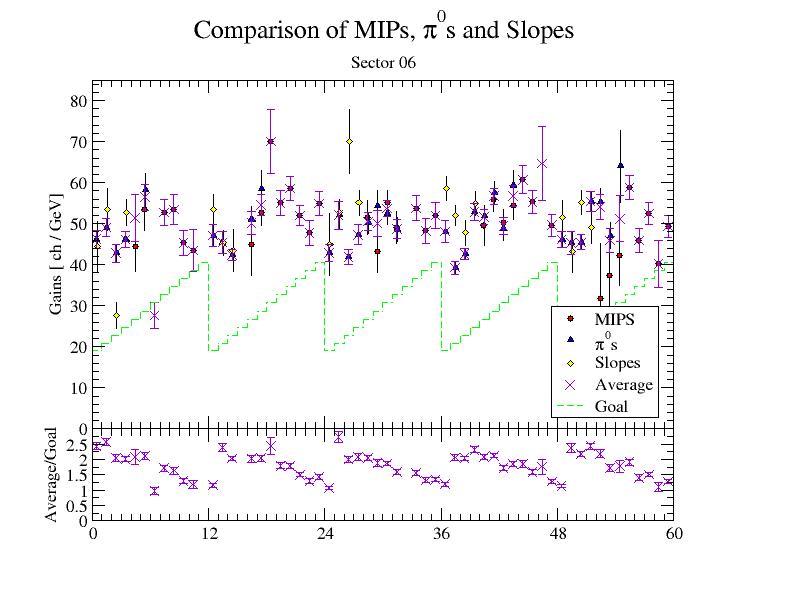
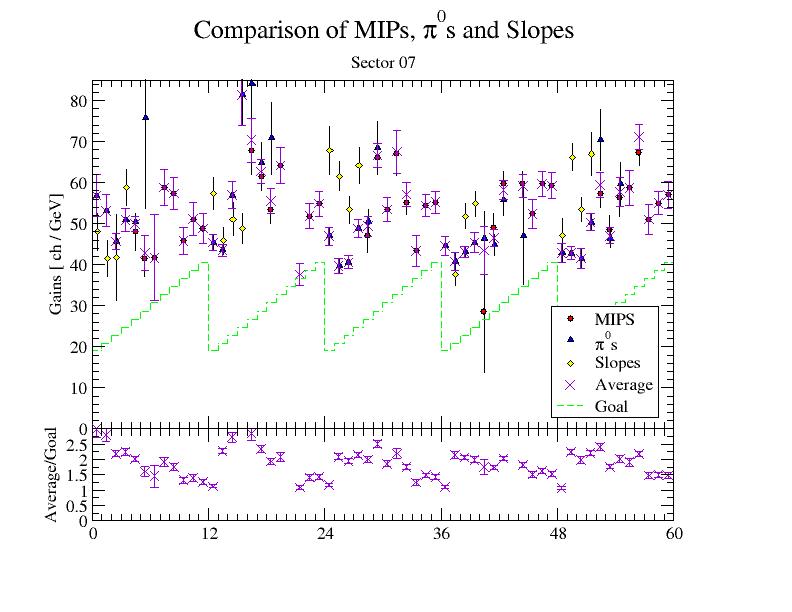
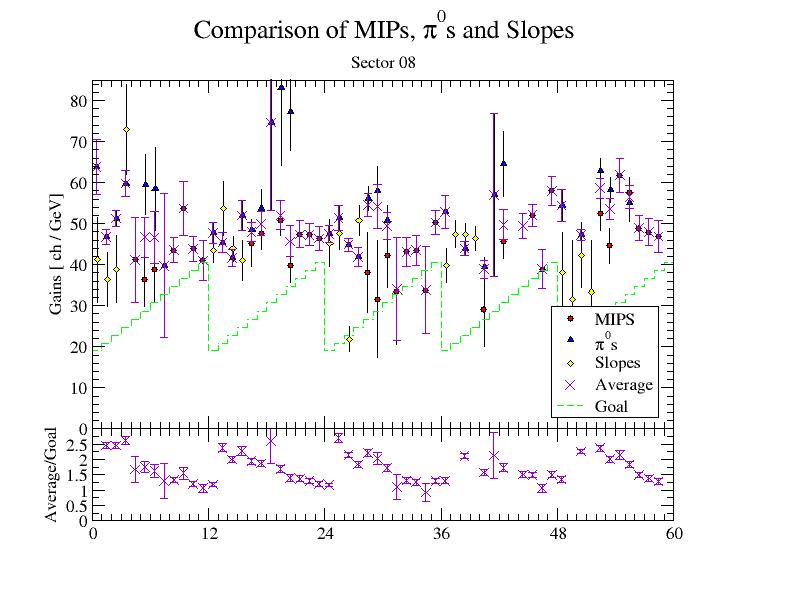
Gains for each tower were extracted by analysing isolated MIPS (see MIP analysis) and by requiring neutral pions to reconstruct to their correct mass (see Pi0n Analysis). The slopes were ignored for the following, except for the one or two bins where both isolated MIPs and pi0ns failed to produce a result.
The best estimate of the gains from pi0ns comes from the set labeled "set439h", which is used as the starting point for this analysis. It resulted in measurements of the gains only for towers xxTy01-xxTy06 (where xx refers to sectors 05-08 and y refers to subsectors A-E) although some towers above xxTy06 are measured with the procedure at the present time.
Since the systematic uncertainties on the MIP- and pi0n-gains were approximately equal, we simply performed a weighted average of the two gains when we had data from both methods for a given tower. The tables below summarize the decisions for each tower
| set450a | |||
|---|---|---|---|
| Sector 05 summary | Sector 06 summary | Sector 07 summary | Sector 08 summary |
The figures below show the gains for each tower from MIPs and pi0ns, and the resulting average. Also shown are the gains from the slope-method where the MIP fits failed. These were used only in towers where no information was available from the pi0ns. The bottom panels show the fractional weight each of each method in each tower for the set450a plots, and the ratio of the average gains to the desired eta dependence for the set450b plots.
NOTE: The only difference between sets 450a and 450b should be a 6% shift in the MIP gains. The pi0n gains were not changed due to a PBCK error (problem between the chair and keyboard). Set 450c (forthcoming) will have a larger eta range available for the pi0ns. Towers where gains are only determined from the slopes are not currently loaded into the database. This accounts for one or two towers.
| set450a | |||
|---|---|---|---|
| Sector 05 | Sector 06 | Sector 07 | Sector 08 |
|
|
|
|
| set450b | |||
| Sector 05 | Sector 06 | Sector 07 | Sector 08 | |
|
|
|
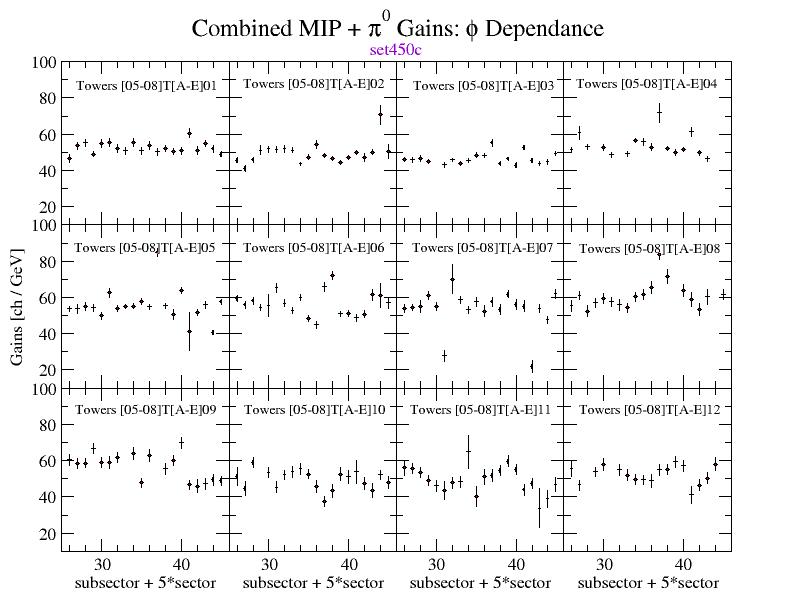
Below I show a plot of the "phi" dependance of the gains in each eta bin. Actually it is plotted versus "subsector + 5 * sector", not phi...
| Gains vs. phi |
|
Pi0n "yield" vs phi |

|
|---|
| Sector | Absolute gains | Gains relative to desired eta dependence |
|---|---|---|
| 5 | sector 05 gains | sector 05 ratios |
| 6 | sector 06 gains | sector 06 ratios |
| 7 | sector 07 gains | sector 07 ratios |
| 8 | sector 08 gains | sector 08 ratios |