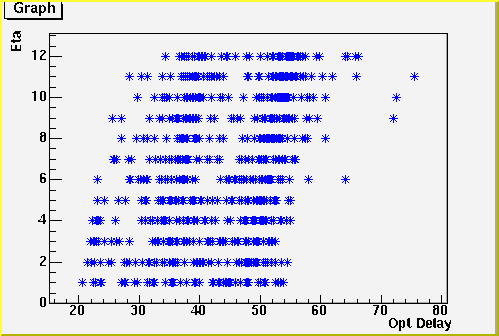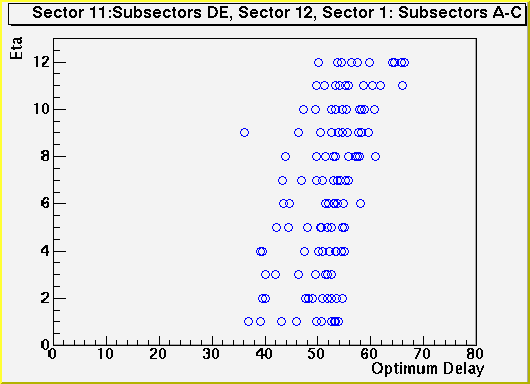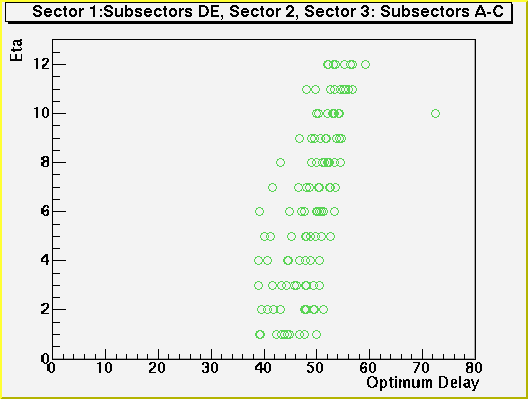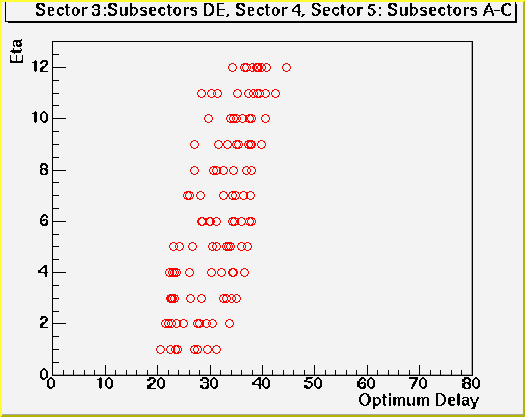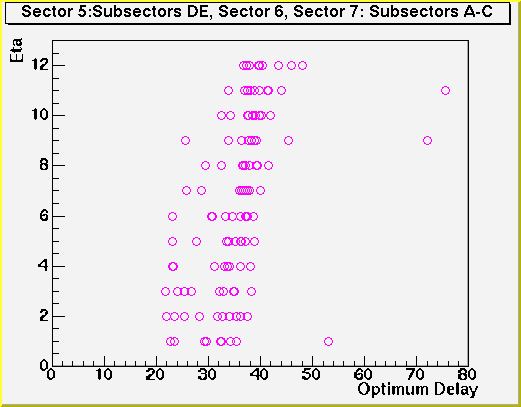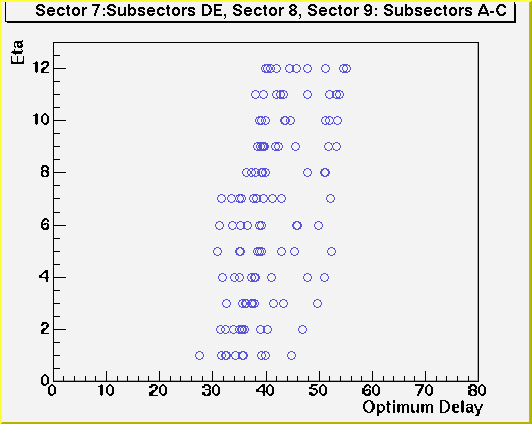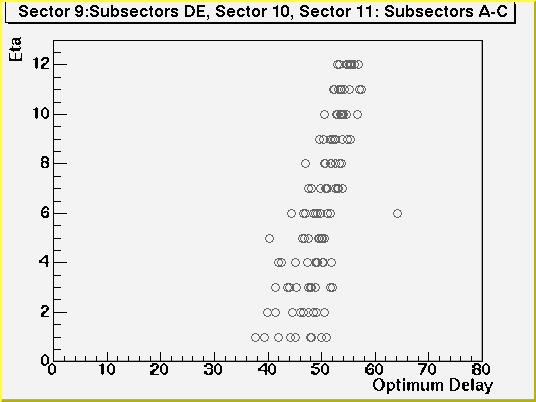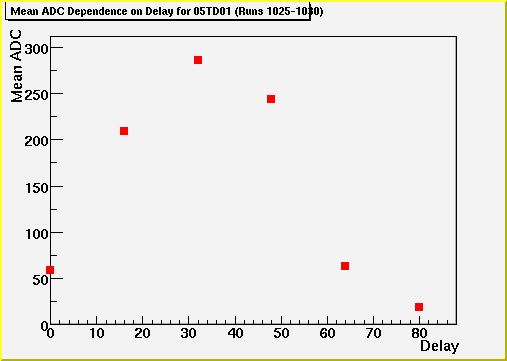
The optimum delay was calculated for each tower using the laser data, runs 1025-1030. For each run the delay was increased by 16 ns (Range: 0-80 ns). The optimum delay for each tower was calculated by finding a mean ADC value for each run and assuming a quadratic shape. Figure 1 below shows the means for tower 05TD01. From these data points, an optimum delay of 34.3371 ns was calculated. This was done for every tower.

