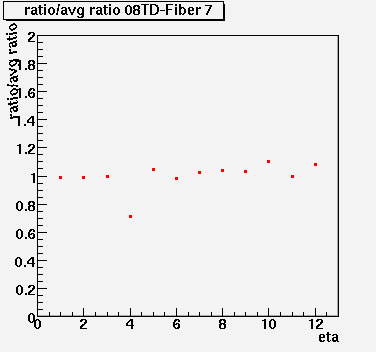
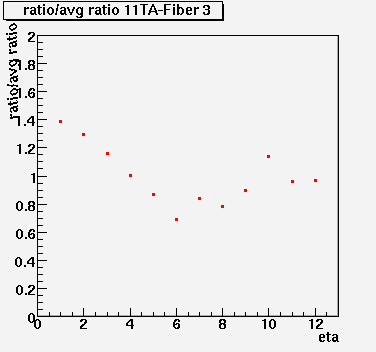
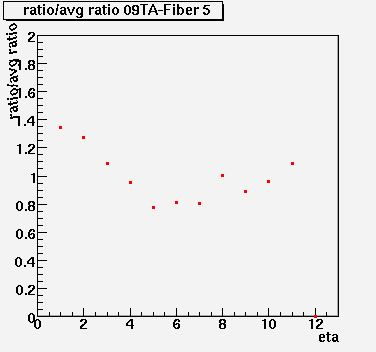
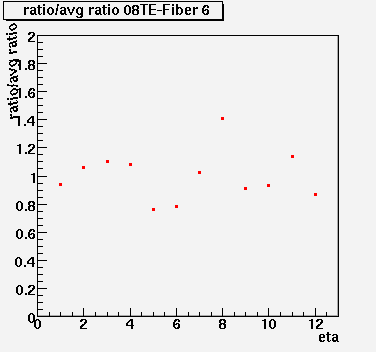
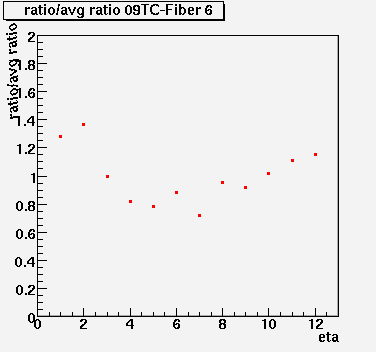
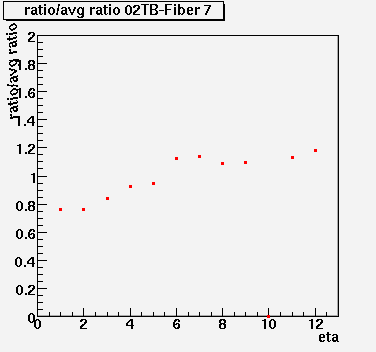
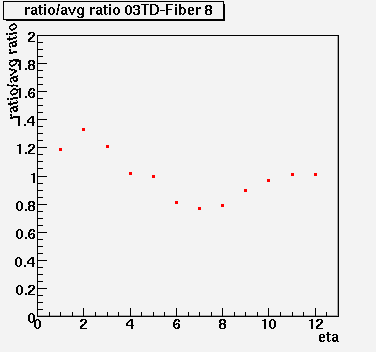
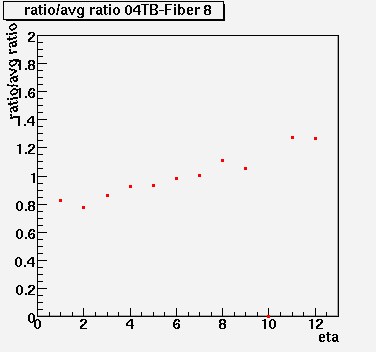
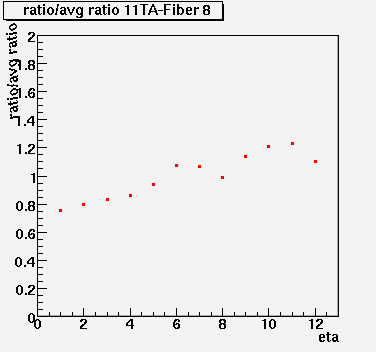
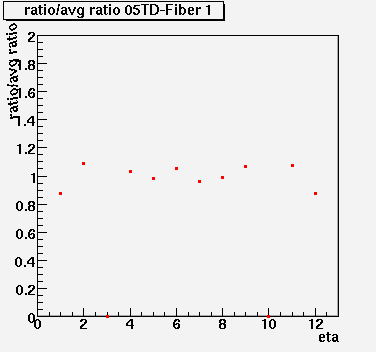
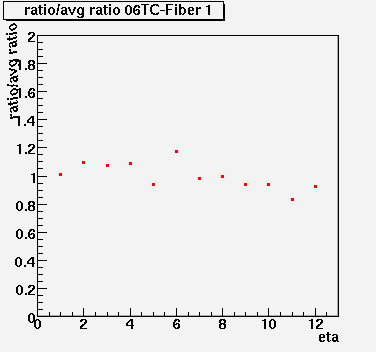
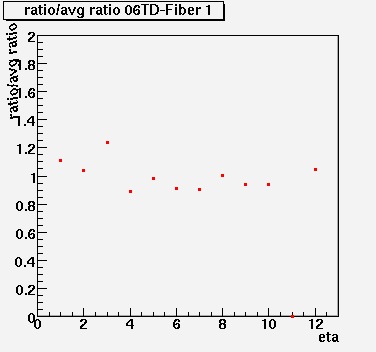
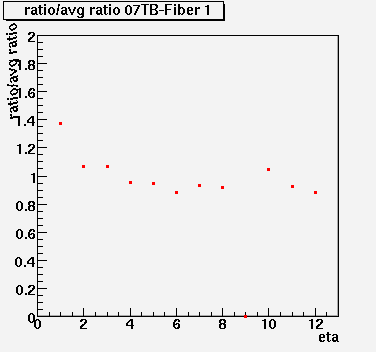
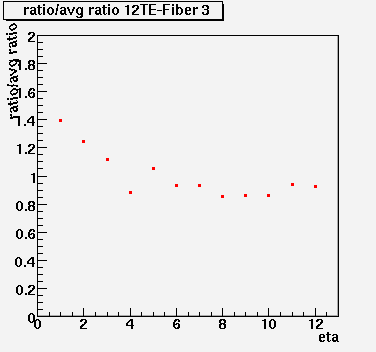
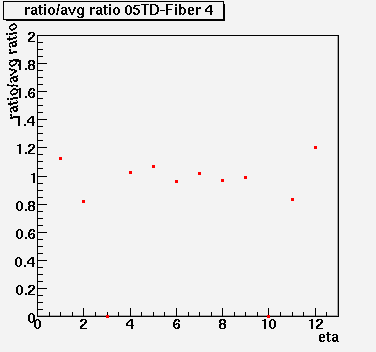
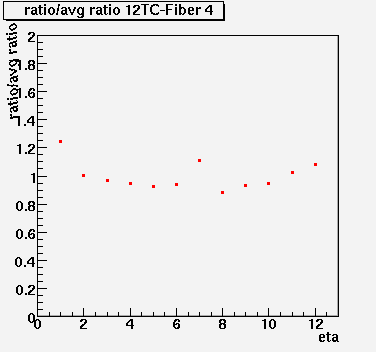
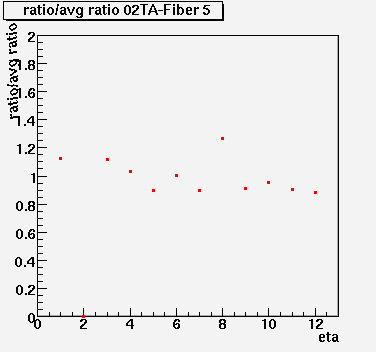
Each of the phi bin graphs below, with the exception of Fig. 1: 08TD-Fiber 7,were made after the chi-squared distribution was plotted for each fiber (See link 6). The chi-squared distribution was used to sort through all the ratio graphs in Link 4, in an attempt to identify problem areas. The phi bins with a chi-squared above 0.02 have been plotted below in Fig. 2 and are considered abnormal. A normal phi bin would have ratio/(avg ratio) around one for all eta. The graphs in Fig. 3 are the result of a modified chi-squared program that looks for ratio/(avg ratio) for etas in a particular phi bin that are not part of a smooth curve - that is, a particular eta that for some reason is recieving less (or more) light than the average value of its neighboring etas.
Figure 1: This is what a broken tile would look like (08TD04), one eta bin is getting approximately two-thirds the amount of light the other eta bins are getting (evidence that one of the three layers the fiber is sending light to is not working properly). However, 08TD04 is a tower that is likely having a negative pedestal (or unknown pedestal) and this affects the ratio! Because of this, the following graph is not clear evidence that there is something wrong with a tile in 08TD04.

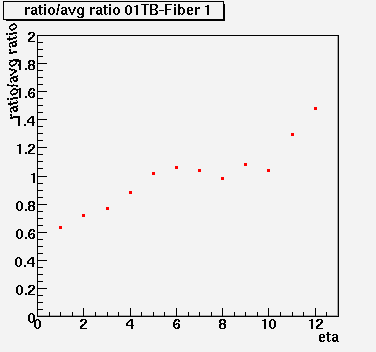
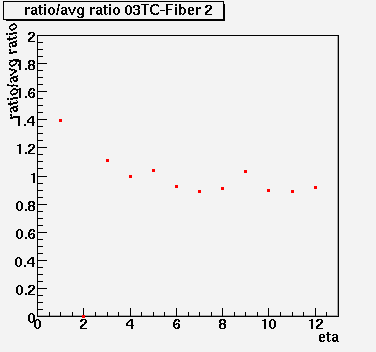
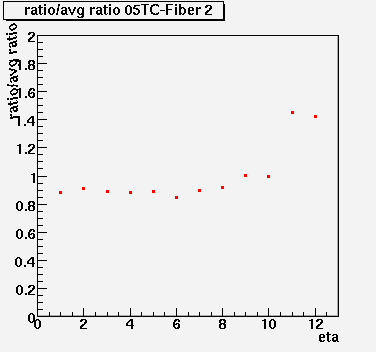


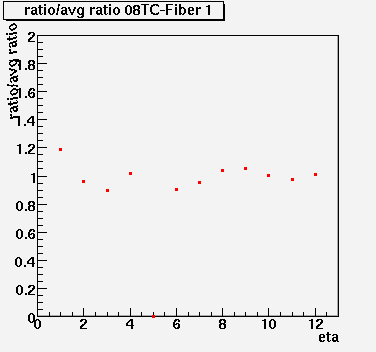
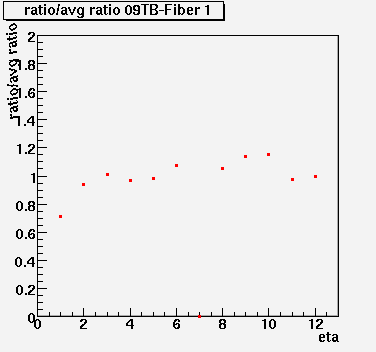
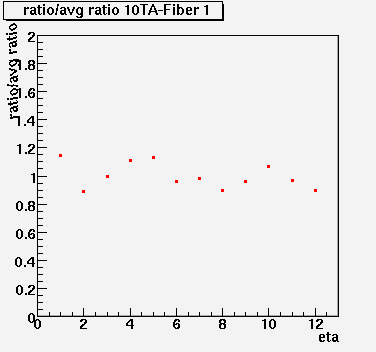

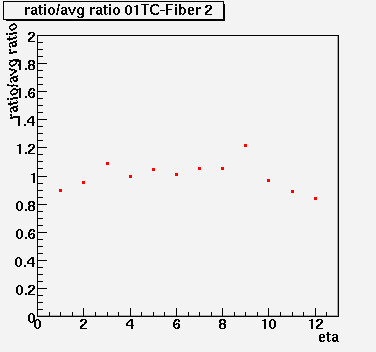


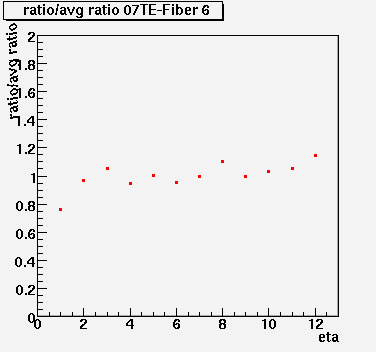

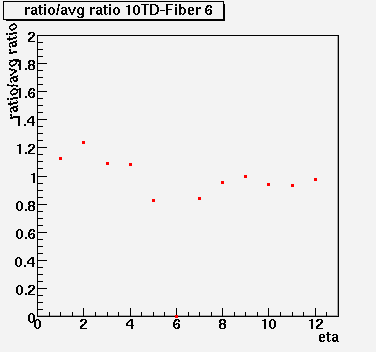
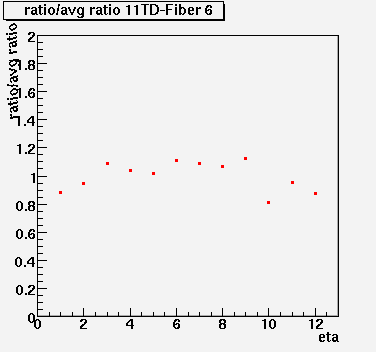
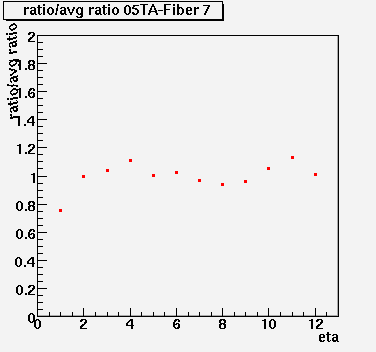
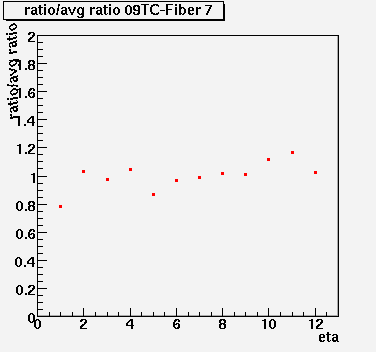
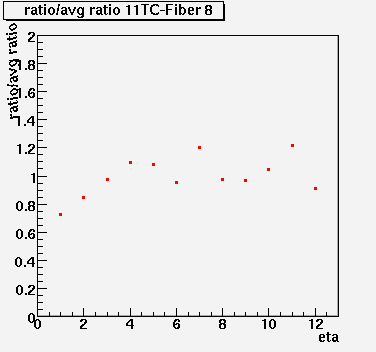
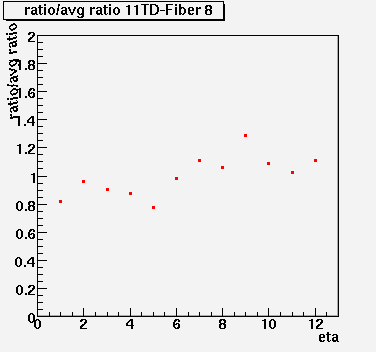
Phi  Eta     Difference

Fiber 1:

05TD eta:  1 diff is 0.210149
05TD eta:  2 diff is 0.210149
05TD eta: 11 diff is 0.203821
06TC eta:  6 diff is 0.212954
06TD eta:  3 diff is 0.276682
06TD eta:  4 diff is 0.222232
07TB eta:  1 diff is 0.304218
08TC eta:  1 diff is 0.226067
09TB eta:  1 diff is 0.227624
10TA eta:  1 diff is 0.253882

Fiber 2:

01TA eta:  8 diff is 0.221047
01TC eta:  9 diff is 0.204480
03TC eta:  1 diff is 0.392869
03TC eta:  2 diff is 0.250528
05TC eta: 10 diff is 0.229308
05TC eta: 11 diff is 0.241964

Fiber 3:

11TA eta: 10 diff is 0.210104
12TE eta:  4 diff is 0.200899

Fiber 4:

05TD eta:  1 diff is 0.304446
05TD eta:  2 diff is 0.304446
05TD eta: 11 diff is 0.370959
12TC eta:  1 diff is 0.237051
12TC eta:  7 diff is 0.200398

Fiber 5:

02TA eta:  7 diff is 0.235624
02TA eta:  8 diff is 0.359195
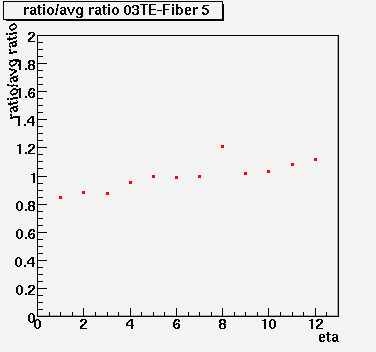
03TE eta:  8 diff is 0.204740
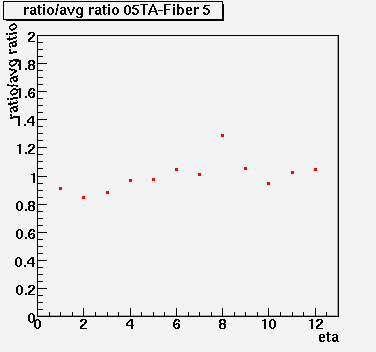
05TA eta:  8 diff is 0.253332
06TA eta:  8 diff is 0.334883
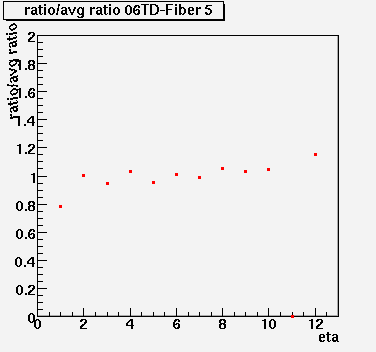
06TD eta:  1 diff is 0.222155
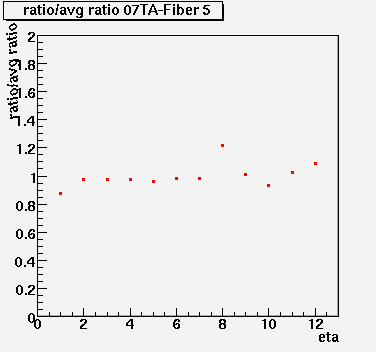
07TA eta:  8 diff is 0.220557
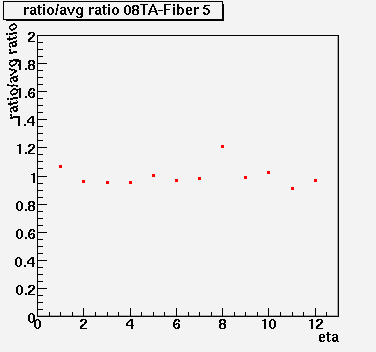
08TA eta:  8 diff is 0.225574
10TA eta: 10 diff is 0.212114
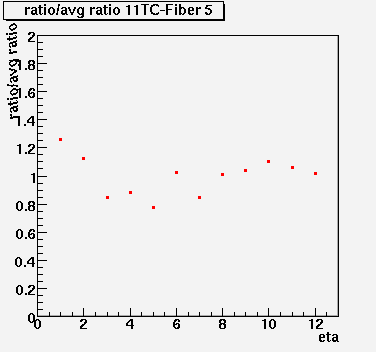
11TC eta:  6 diff is 0.216653
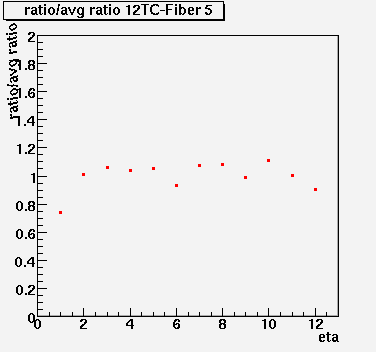
12TC eta:  1 diff is 0.268166

Fiber 6:


06TE eta:  8 diff is 0.221721
07TE eta:  1 diff is 0.208168
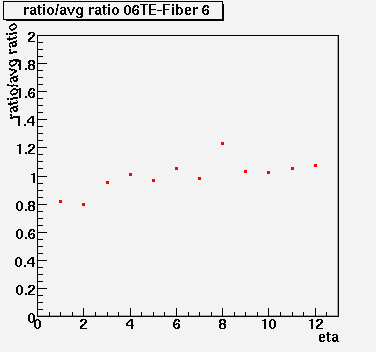
08TE eta:  8 diff is 0.440865
08TE eta:  9 diff is 0.259631
08TE eta: 11 diff is 0.240142
09TA eta:  5 diff is 0.215204
09TC eta:  2 diff is 0.226742
09TC eta:  7 diff is 0.203462
10TD eta:  5 diff is 0.254422
11TD eta: 10 diff is 0.226887

Fiber 7:

05TA eta:  1 diff is 0.240256
08TD eta:  4 diff is 0.305848
09TC eta:  1 diff is 0.243938

Fiber 8:

11TC eta:  7 diff is 0.238319
11TC eta: 11 diff is 0.235444
11TD eta:  9 diff is 0.215131
     For Fiber 5: 2TA,5TA,6TA,7TA,8TA, and 3TE all have eta=8 higher than other etas

     A lower ratio/avg ratio for eta=1 is likely explained by the physical layout of the fiber. As the fiber was
     attached to a megatile, it was more likely to twist at eta=1 because the fibers were glued in starting at eta=12.
     So the scratch in the fiber at eta=1 is not lined as well. Thus it is likely not receiving as much light as higher eta.

     A trend of fairly linear, increasing ratio/avg ratio is likely from a twisted fiber in a megatile. Again,
     as the fibers were glued in beginning with eta=12, it is likely to have the scratch in the fiber that carries
     the laser light to each tile in a megatile aligned better than at eta=1. Therefore, eta=12 appears to be
     receiving the most light, and a twist in the fiber would cause etas preceding 12 to have the scratch misaligned
     more drastically as eta decreases to 1.

     Ratio/avg ratios that deviated from one drastically (as in ratio above 2 or equal to zero) show up as zeros on the graph.
     If a zero was encountered as a neighbor to the eta for which the difference was calculated, the next (or previous
     depending on location) eta bin was used to find average of neighboring etas. For eta=1, eta=2 was used to find
     the difference, and for eta=12, eta=11 was used to find the difference.