E = 2.0 GeV


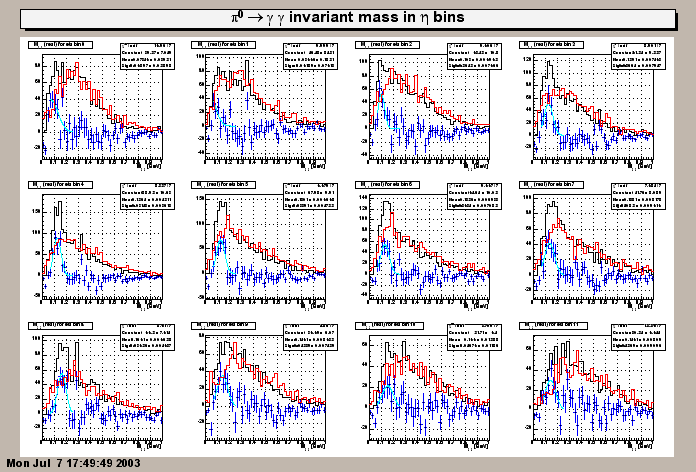
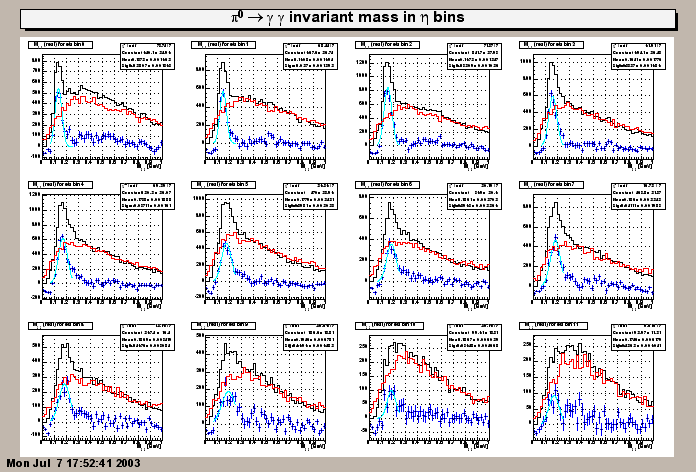
Pi0's were reconstructed using Jan's algorithmn, cuts, 50 ch/GeV sampling fraction, etc... See here. The pi0's were binned in eta bins, where eta was taken to be the pseudorapidity of the more energetic of the two gammas. Minbias and high tower triggers were studied separately.
Mass spectra in each eta bin. Black (red) histograms represent real (mixed) events. Blue points w/ uncertainties are background subtracted.

This might be overly simplistic, but... one can deduce a gain shift relative to the true gain by comparing the invariant mass-squared of the measured pi0 to the true mass:
Since M2 = 4 E1E2 sin phi / 2,
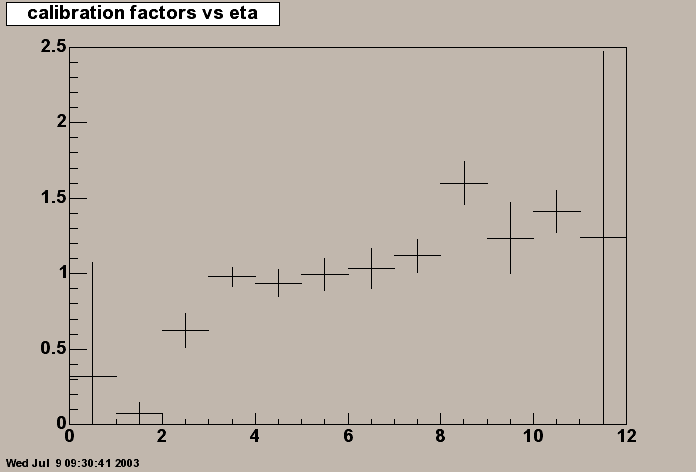
M2 / M2pi = gactual / gnow... So, taking the squared-ratio of the reconstructed pi0 mass to its real value as a function of eta, we obtain the following plot. Note that the fits failed in the first two eta bins. One might be tempted to conclude from this plot that the current set of gains ("SF = 50 ch/GeV, relative gains from MIPs (for eta bin 1-4) & slopes (1-4)") are consistent with the pion spectra, at least to the 20% (or so) level.
NOTE: We are now taking the _average_ over all eta bins as our reference mass instead of the true pion mass. This demonstrates the eta dependence of the algorithmn/calibration.

See also plots of the energy-sharing (z) and transverse momentum distributions in each eta bin.

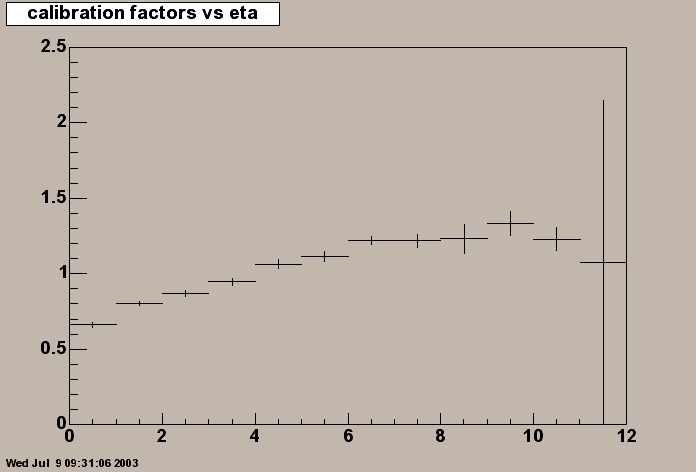
Again we plot the squared ratios of the measured mass to the real mass of the pi0 as a function of eta. Clearly the high-tower and min-bias data samples have different behaviors.

See also plots of the energy-sharing (z) and transverse momentum distributions in each eta bin.
Uses MC data samples from /star/data04/sim/balewski/fzd/mc*gid7*wide.fzd.
The statistica are not great, but the low pT Monte Carlo data
does agree with the min-bias trigger in terms of relative calibration.
The MC data used is very statistics limited.
directory containing figures (may have more goodies...)