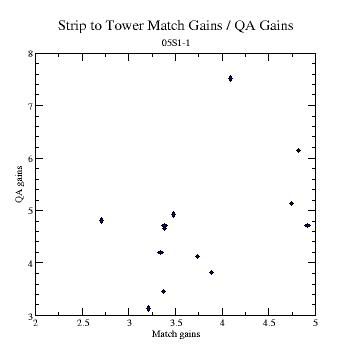
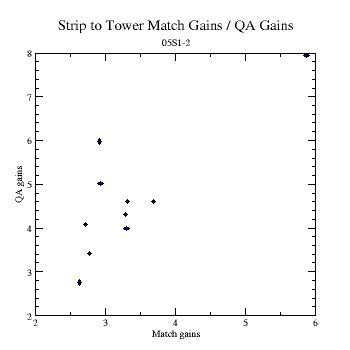
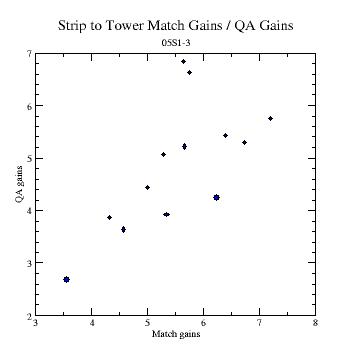
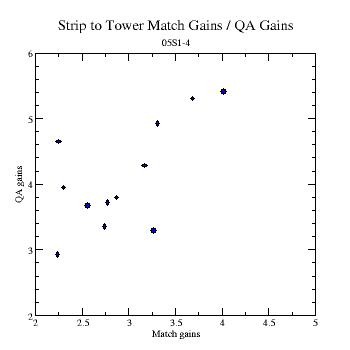
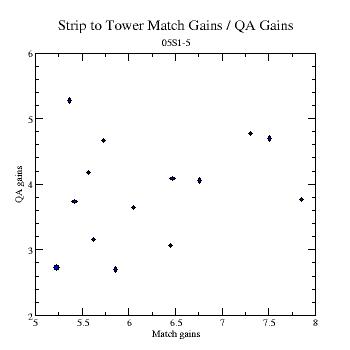
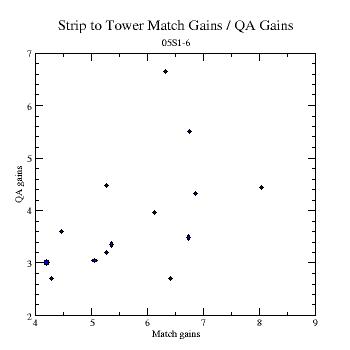
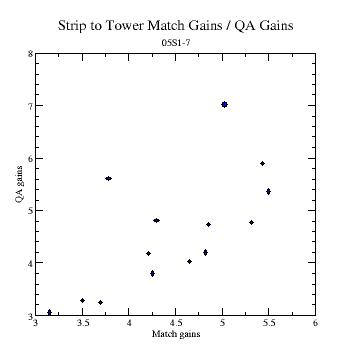
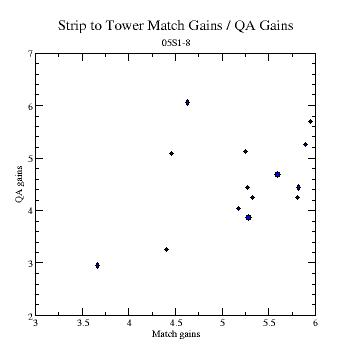
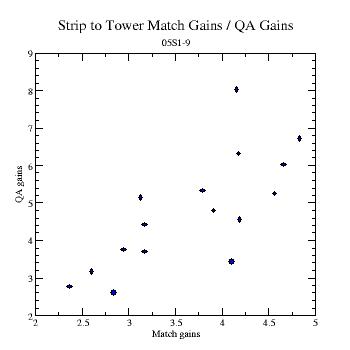
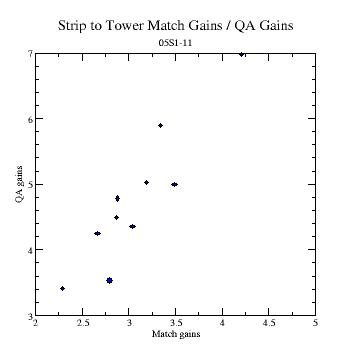
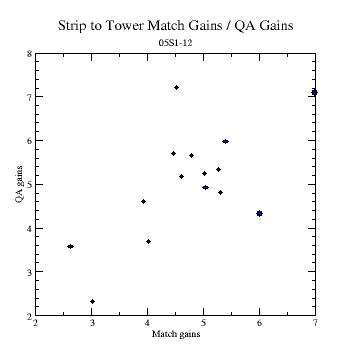
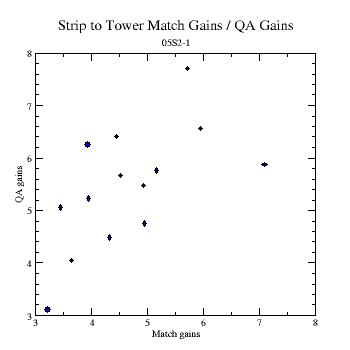
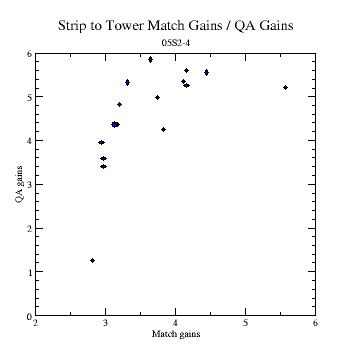
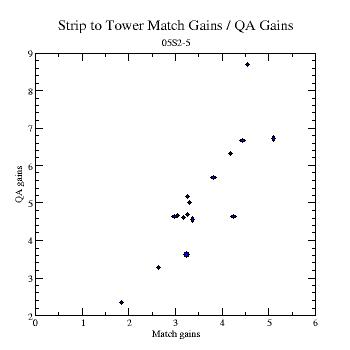
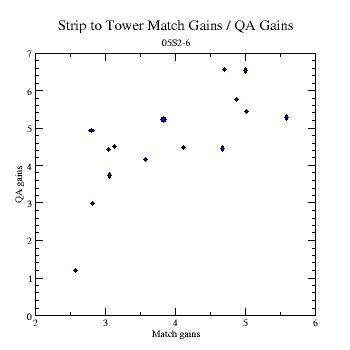
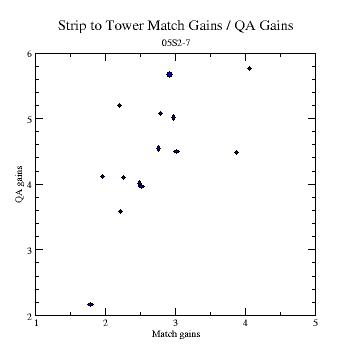
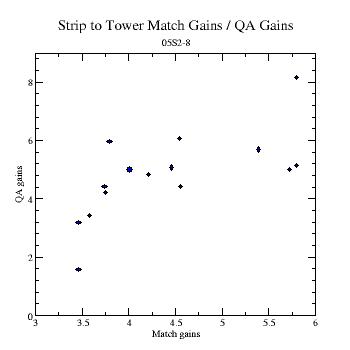
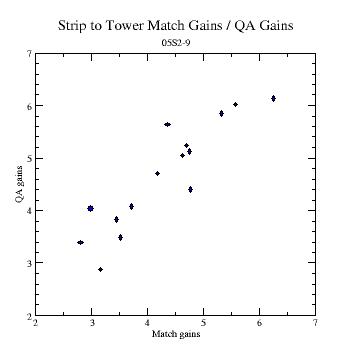
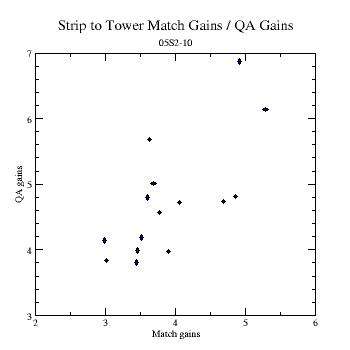
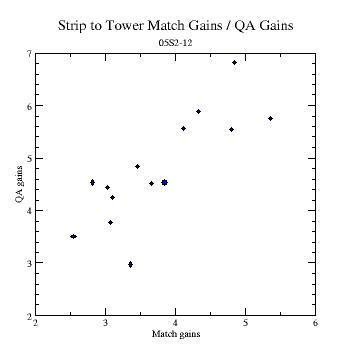
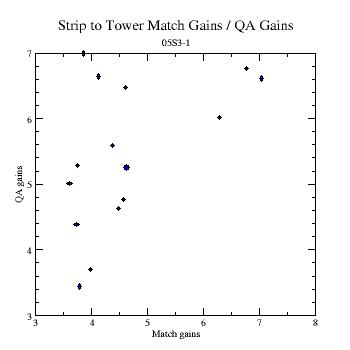
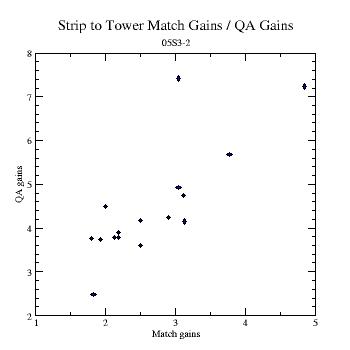
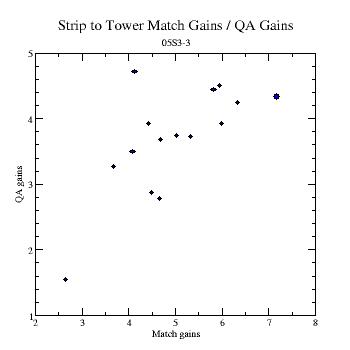
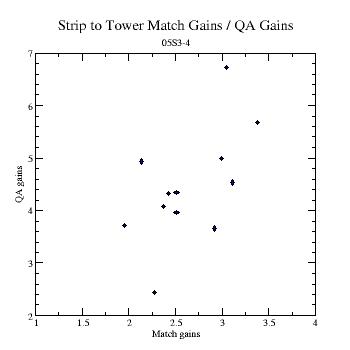
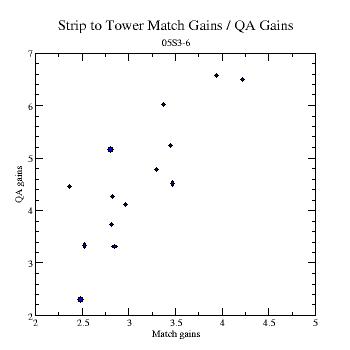
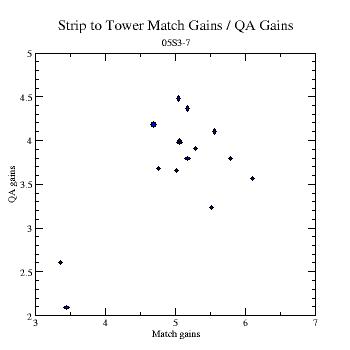
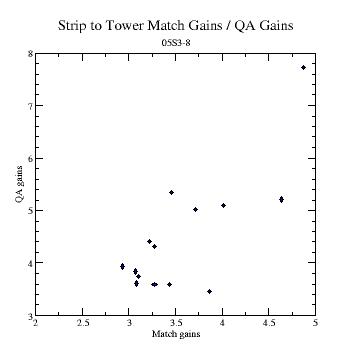
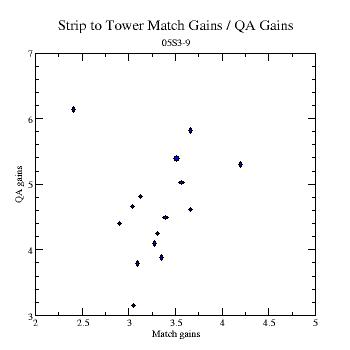
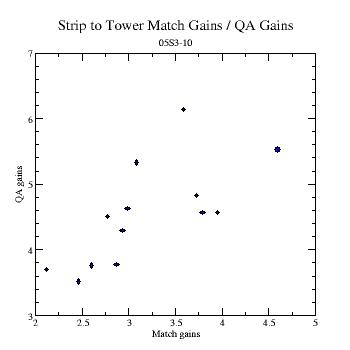
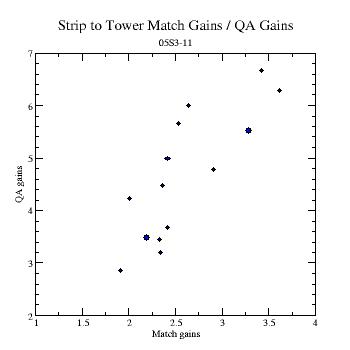
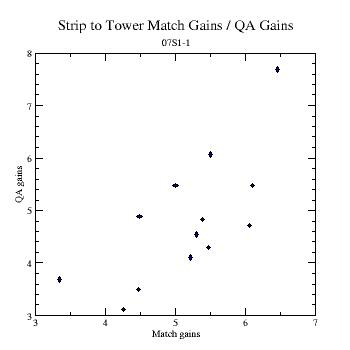
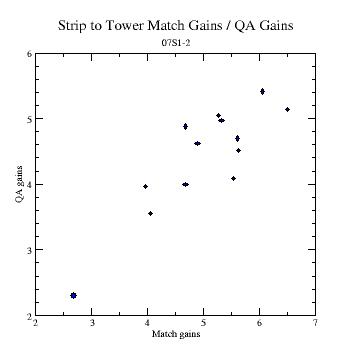
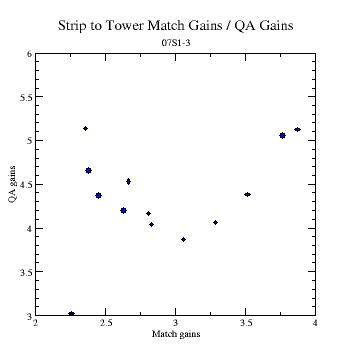
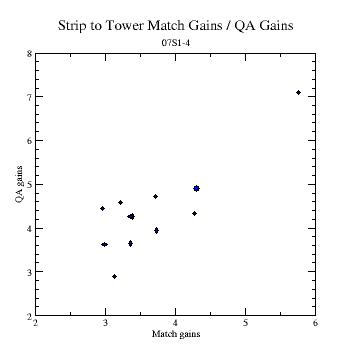
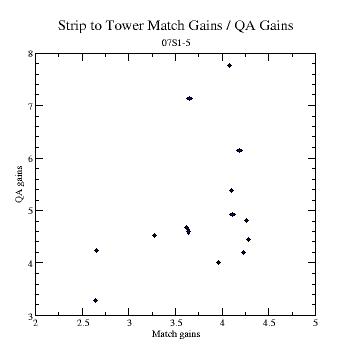
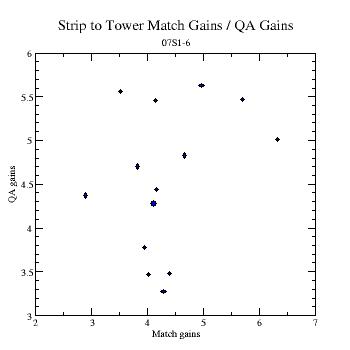
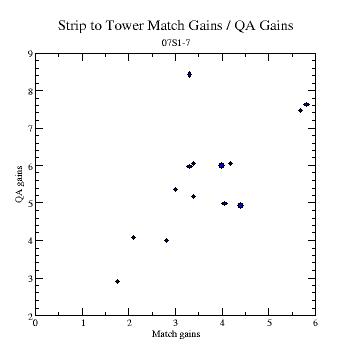
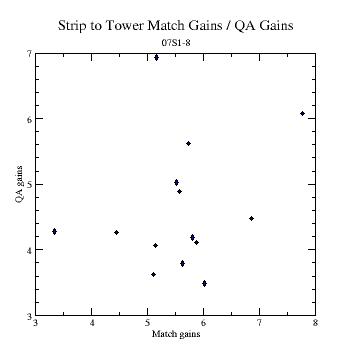
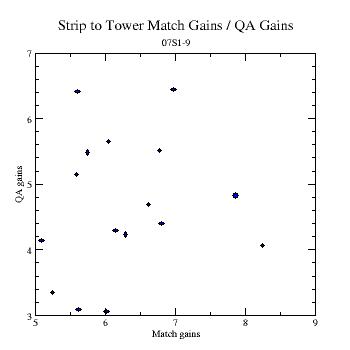
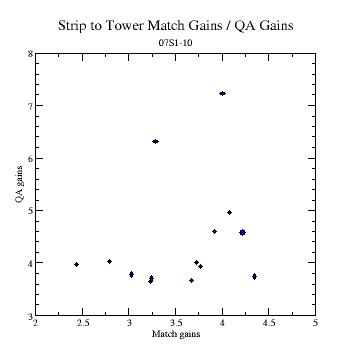
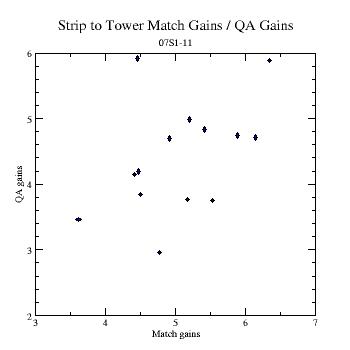
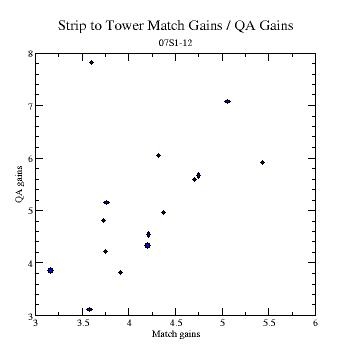
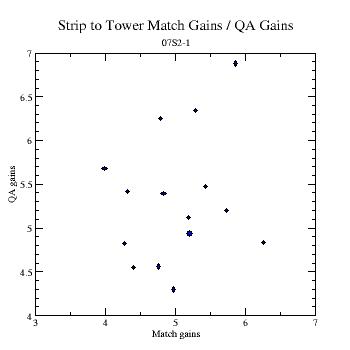
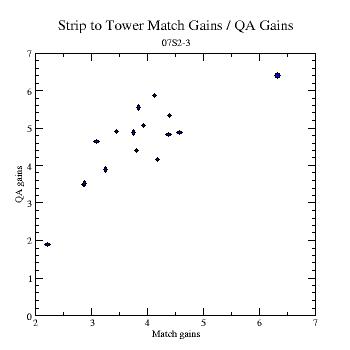
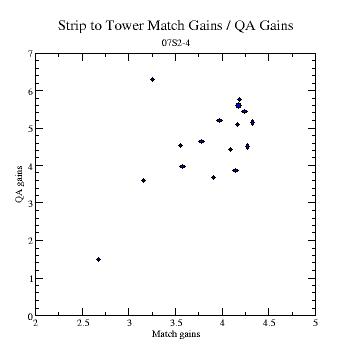
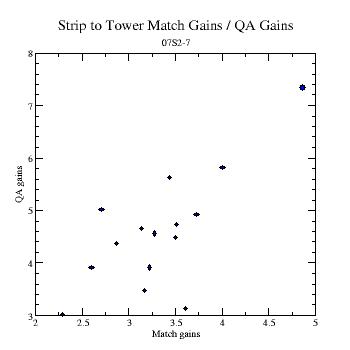
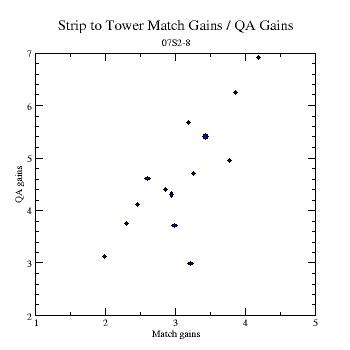
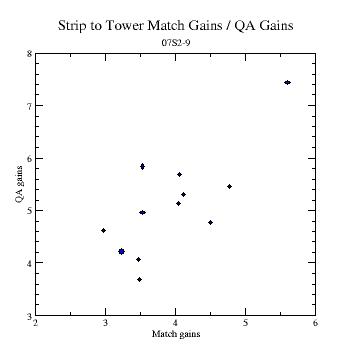
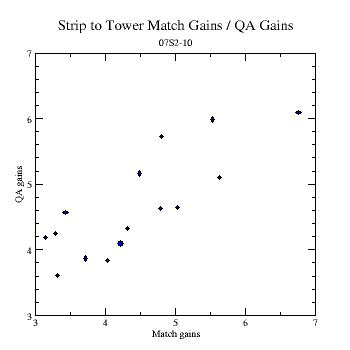
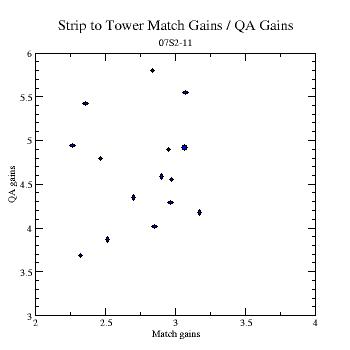
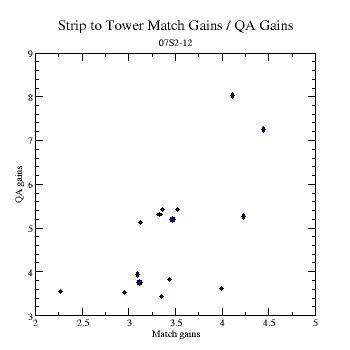
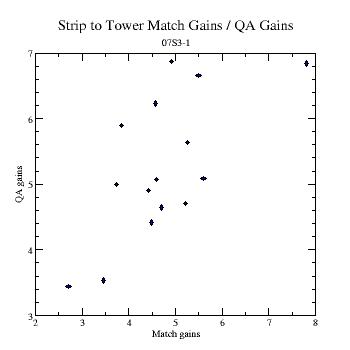
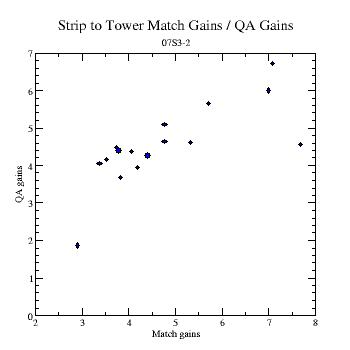
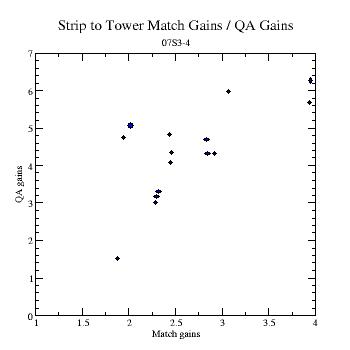
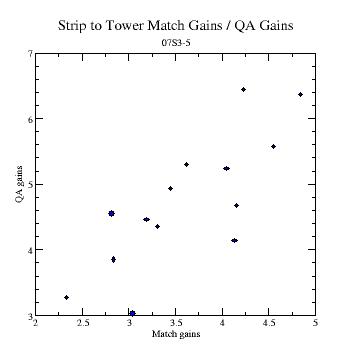
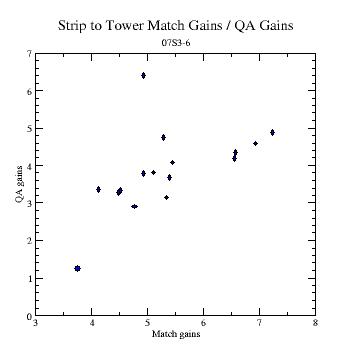
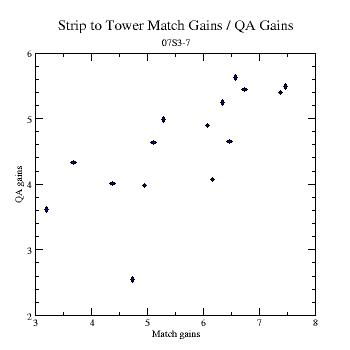
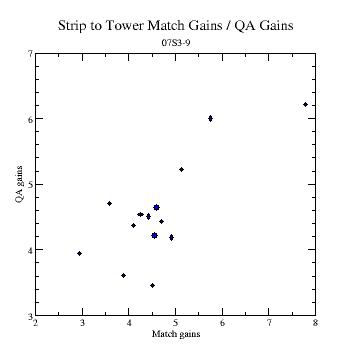
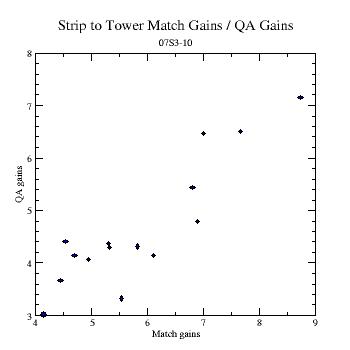
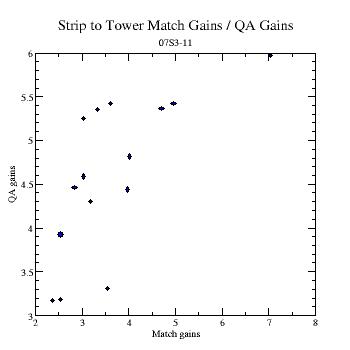
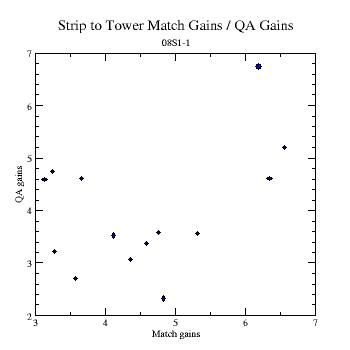
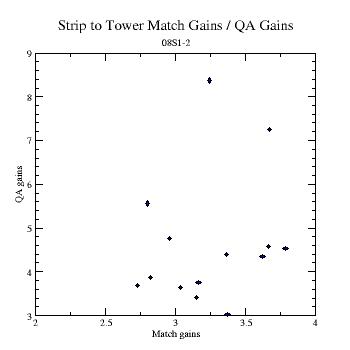
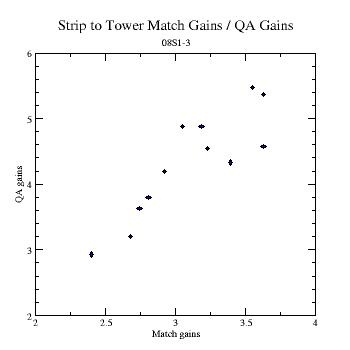
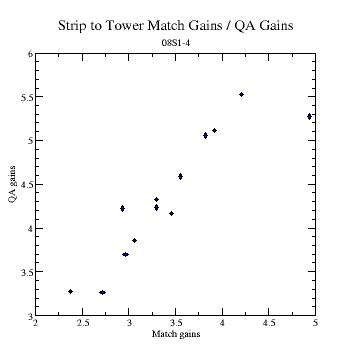
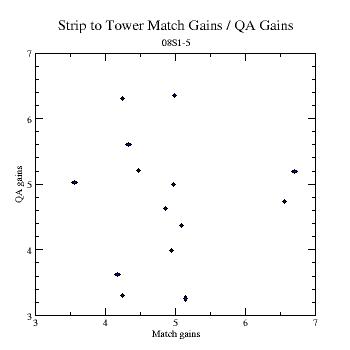
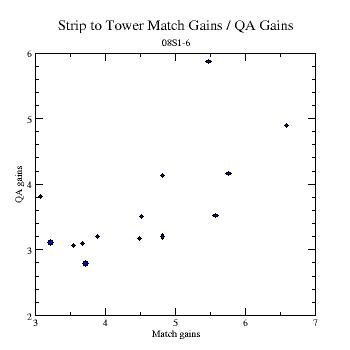
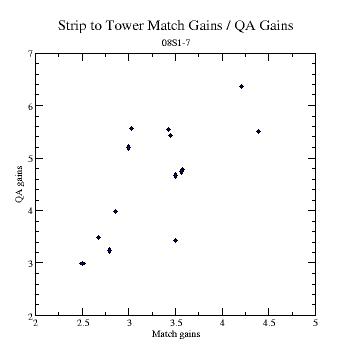
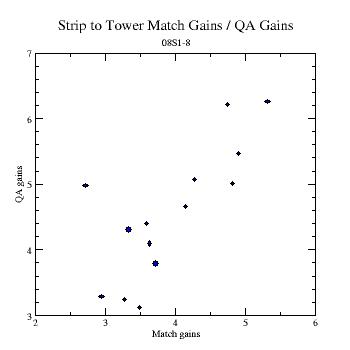
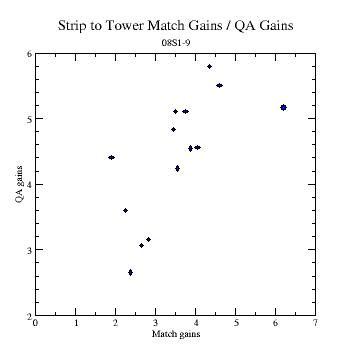
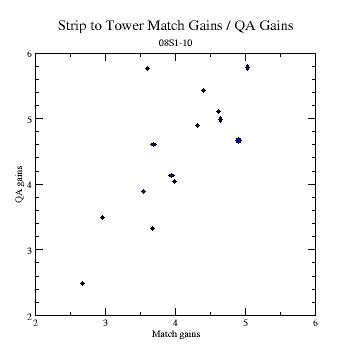
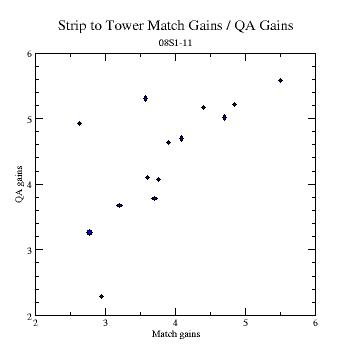
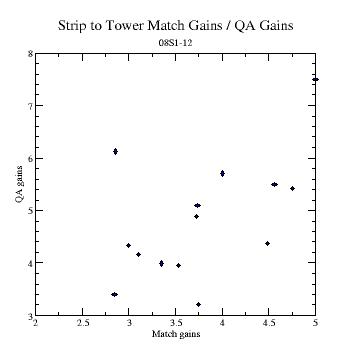
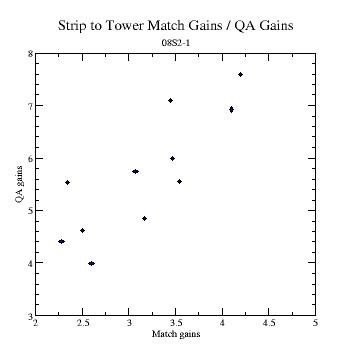
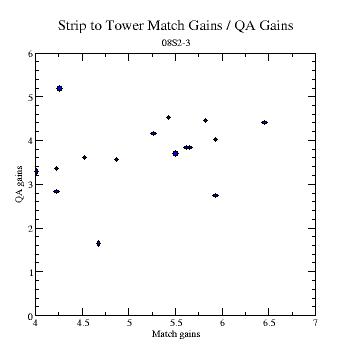
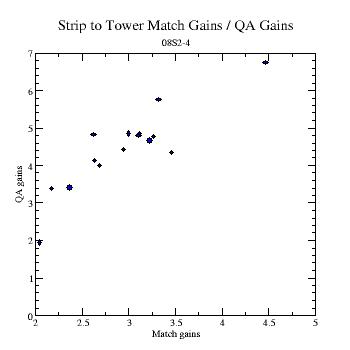
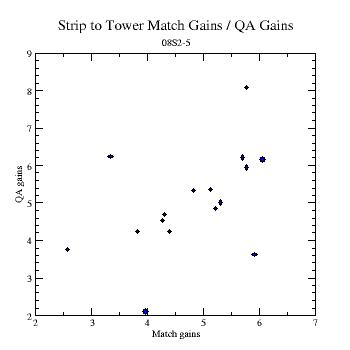
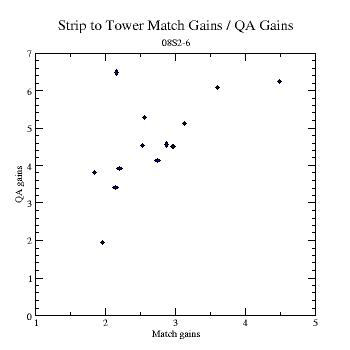
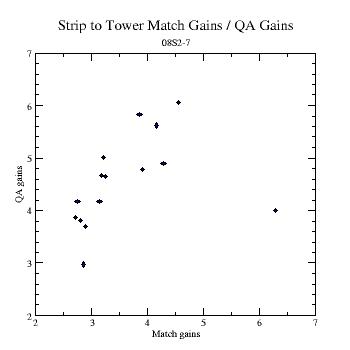
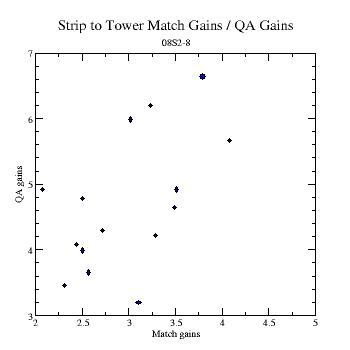
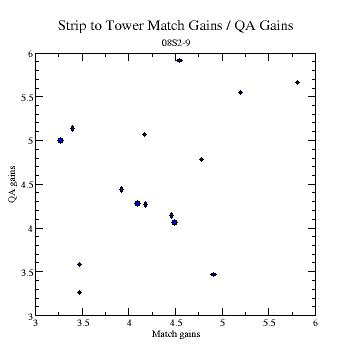
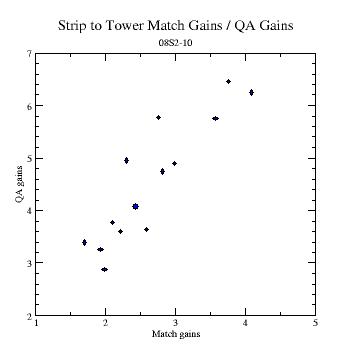
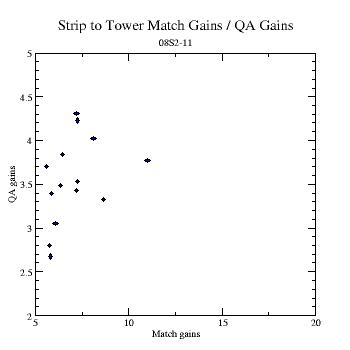
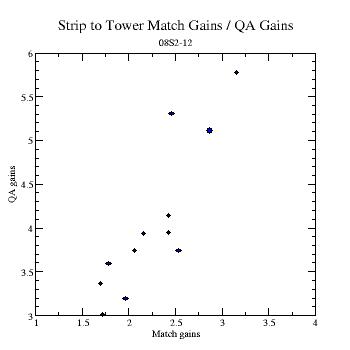
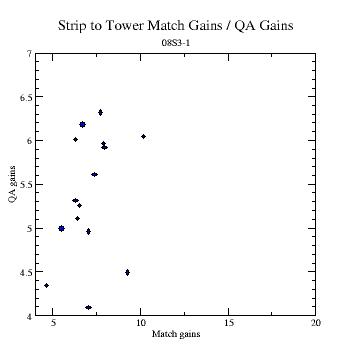
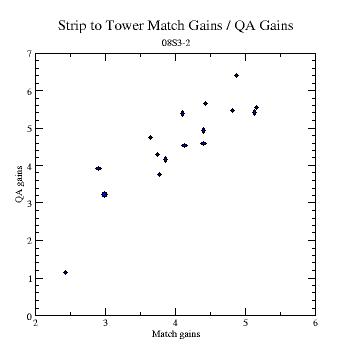
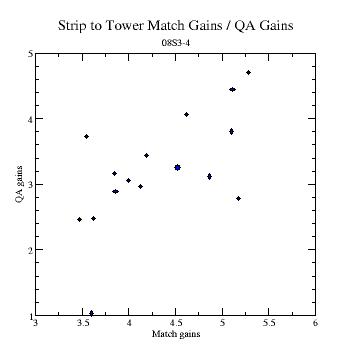
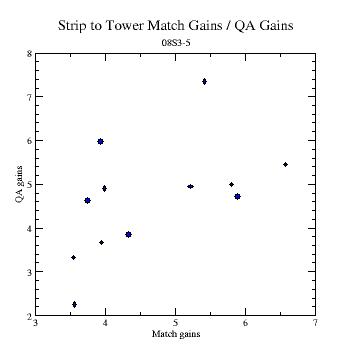
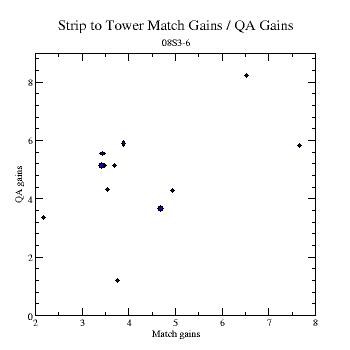
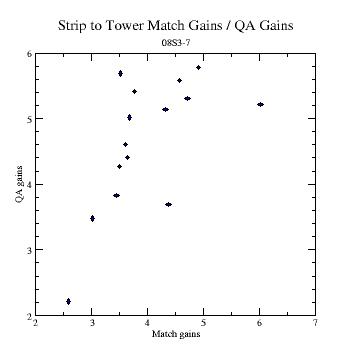
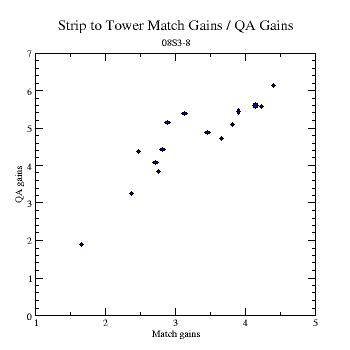
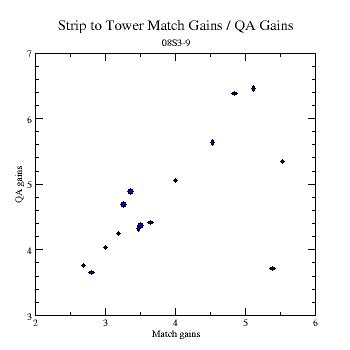
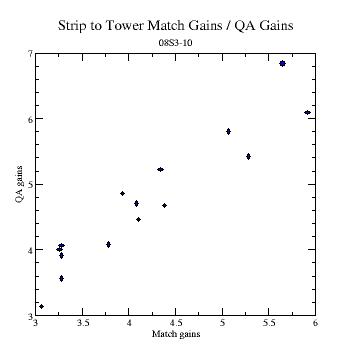
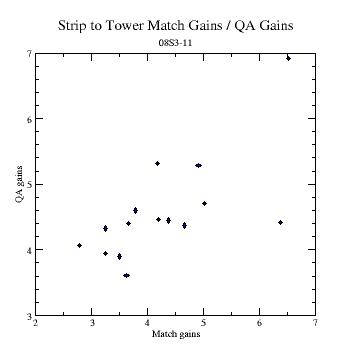
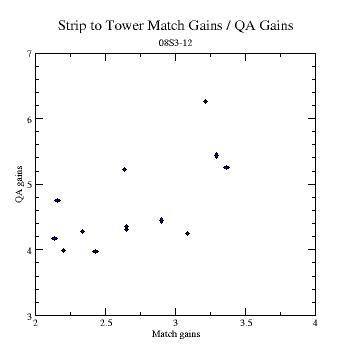
Below are plots showing the ratio of the tower-to-strip matching
gains to the QA gains. Plots are broken down for each MAPMT
box by MAPMT (tube). X axis, gains from matching strip response
to tower response. Y axis, QA gains.
MAPMT Box 05S1
MAPMT Box 05S2
MAPMT Box 05S3
MAPMT Box 07S1
MAPMT Box 07S2
MAPMT Box 07S3
MAPMT Box 08S1
MAPMT Box 08S2
MAPMT Box 08S3
Jason C. Webb
Last modified: Tue May 18 17:28:17 EDT 2004