Check of tower system using MIPs from UxV method

  • Data from: 107k minB events from CuCu200, run 6049129.
  • pedestals 'onlped', no gains

    Tuned UxV method requires:
    * strip fired if ADC > ped+15
    * SMD hit patterns: 000000xx000000 or 000000x000000
    * UxV intesection points is in 0.6^2 of fiducial area of a tower
    * tower MIP condition: ADC in [0.5,2]*MIP response (green lines on spectra)
    * preshower1,2 MIP condition: ADC in [12,112]
    * post-shower MIP condition: ADC in [6,106]

    X-Y position of all MIP points (after mapping correction and masking of dead towers/tiles - described below) (PS.gz) . View from the outside, sector numbering clock wise. Magenta triangles mark 3 dead towers, red spots reflect 12 masked pre/post shower tiles.

  • List of all masked towers/tiles , as of day 49. There were 3 broken towers and 12 not functioning per/post-shower tiles. It means 705 of 720 towers were fully functional.

  • Swaps - just 2 for all 12 sectors:
    * Towers : 01TA05 < -- > 01TA04
    * pres2 : 01QA11 < -- > 01QB02
    This needs to be changed in the DB. Note, there is few more questionable towers but w/o gain correction it is hard to assess if anomalies are caused by the mapping.

  • Example of tower response to MIP. 4 plots on the left are for 4 (working) layers tower 01TC12: tower ADC,pres1,pres2, and post-shower. Black line - inclusive spectra. Red histo - MIP condition on all except this leyer. Blue histo - full MIP condition. R= blue/red.
    The red-dashed line in the tower spectrum marks expected MIP response for the ideal calibration of 60 GeV ET @ 4096 ADC.
    All 4 leyers are working properly Post-shower is broken

  • Example of 1A5 response to MIP before and after swap of tower ADCs. (The spectra below are not sufficient to conclude the towers A4 & A5 need to be swapped.)
    tower spectrum has too large pedestal after swap of towers A4 & A5 the pedestal is lower

    Table with plots (PDF) showing reponse of all 720 towers/pre/post to MIP:
    PLOTS PLOTS *) broken elements
    sector 1 spectra yield tower C6, post D12
    sector 2 spectra yield all works
    sector 3 spectra yield post E12
    sector 4 spectra yield all works - within statistics
    sector 5 spectra yield pres1: C10, D11, E2; pres2 E3
    sector 6 spectra yield tower A3
    sector 7 spectra yield tower C5, post D3;
    tower B9(x=17) had gain 40% too large -is fine
    sector 8 spectra yield pres1 C11, post D7,D9,E5
    funny pattern - but for now ( w/o gains) OK
    sector 9 spectra yield all works
    sector 10 spectra yield pres2 E10
    sector 11 spectra yield pres1 D3(x=49) has very low gain,
    but all OK within statistics
    sector 12 spectra yield all works
    note tower C5 with ped @ ADC ~230 works fine
    *) broken elements are masked out and may be not seen on the yield plots.

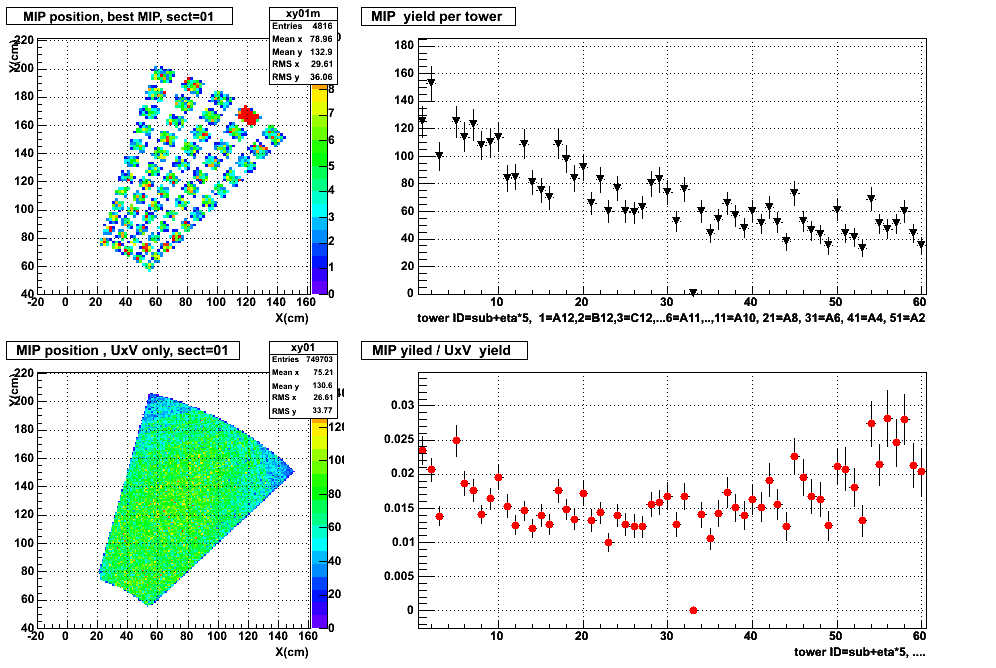
  • Example of MIP yield for sector 1.
    A - MIP X-Y position after all cuts (red blob due to masked post shower D12)
    B - MIP yield from tower spectra after all cuts. The key to X-axis index is below the plot
    C - MIP X-Y position only SMD cuts before tower fiducial cut (input).
    D - MIP yield from B dived by # MIPs avaliable from SMD & fiducial cut.

    Key to X-axis index (Zig-zag from eta=1 -- > eta=2)

     1=A12  11=A10  21=A8  31=A6  41=A4  51=A2
     2=B12  12=B10  22=B8  32=B6  42=B4  52=B2
     3=C12  13=C10  23=C8  33=C6  43=C4  53=C2
     4=D12  14=D10  24=D8  34=D6  44=D4  54=D2
     5=E12  15=E10  25=E8  35=E6  45=E4  55=E2
     6=A11  16=A09  26=A7  36=A5  46=A3  56=A1
     7=B11  17=B09  27=B7  37=B5  47=B3  57=B1
     8=C11  18=C09  28=C7  38=C5  48=C3  58=C1
     9=D11  19=D09  29=D7  39=D5  49=D3  59=D1
    10=E11  20=E09  30=E7  40=E5  50=E3  60=E1
    

    Used script plPresMap.C