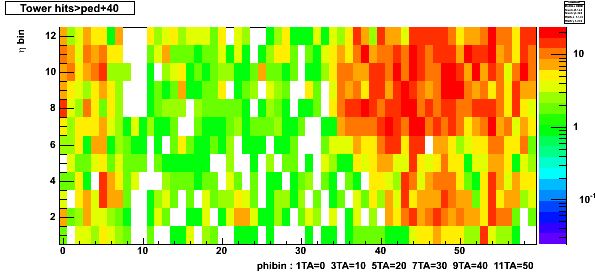
plot: X=phiBin, Y=etaBin, Z=rate per tower

Y=1 is @ eta=2.0; Y=12 is @ eta=1.0
| DSM thresh | run No. | tot inp eve | EHT1 eve | minB eve | minB presc |
|---|---|---|---|---|---|
| ETH1=5 | R6103022 | 56421 | 25058 | 1467 | 1085 |
| ETH1=11 | R6103025 | 6355 | 1686 | 2606 | 1058 |
| ETH1=21 | R6103029 | 4584 | 392 | 3996 | 1041 |
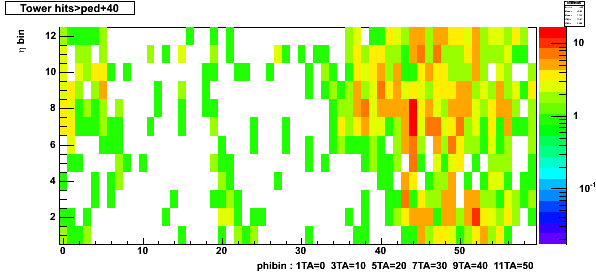
plot: X=phiBin, Y=etaBin, Z=rate per tower

Y=1 is @ eta=2.0; Y=12 is @ eta=1.0
plot: X=phiBin, Y=etaBin, Z=rate per tower

plot: X=phiBin, Y=etaBin, Z=rate per tower
