 Ratio of total charge in all reconstructed clusters in FTPC
East to West for low (solid line), mid (dashed line) and high
(dotted line) multiplicity events. Should be peaked at ~1.
This document explains the FTPC Offline QA reference histograms for the Year 2006 data runs. For Year 2006, the EventQA histograms are divided into a set of general histograms and one or more multiplicity/trigger class histograms. In comparing the following page numbers and plots to what you have in the actual QA postscript files for your specific QA job, you may notice that things do not match page-by-page. The actual set of QA histograms generated during reconstruction depends on the set of Makers which are active in the chain. However, all plots in the EventQA files should be described here but may not appear on the specified page.
The histograms shown here are for the ppProduction run st_physics_7075188_raw_1030004. The postscript version of the Year 2006 QA reference histograms for this run
is available in
Checking FTPC QA histograms with less than 400 pp events does not make much sense because of inconclusive statistics. For run 7075188, the "high tower histogram" set should be used. There are too few minbias events in this set to produce significant plots.
The offline QA histograms are used to monitor the functioning of the FTPC, its read-out electronics, the calibration corrections and the
cluster and track finding parameters which are used in reconstruction.
Please report significant changes to the FTPC mailing list: ftpc-hn@www.star.bnl.gov
Janet Seyboth, Max-Planck-Institute for Physics, Munich, Germany
March 2006
 Ratio of total charge in all reconstructed clusters in FTPC
East to West for low (solid line), mid (dashed line) and high
(dotted line) multiplicity events. Should be peaked at ~1.
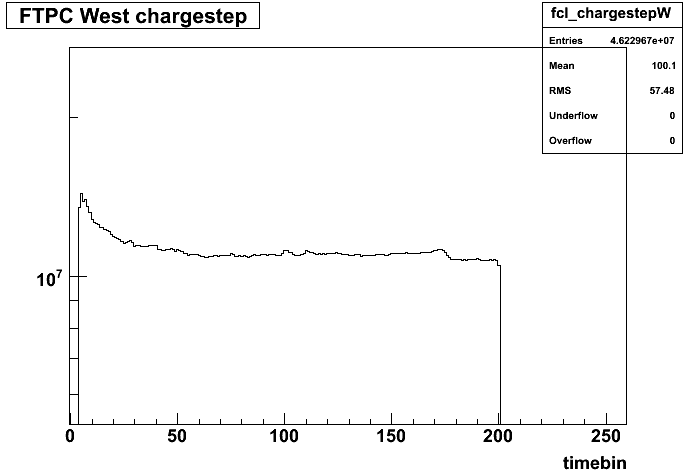 The real chargestep corresponds to the maximum drift time in FTPC West
(clusters from inner radius electrode) and is located near 170 timebins.
This position will change slightly with atmospheric pressure. The hits
beyond the step at timebin 170 are due to electronic noise and pileup. This step
should always be visible even if it is only a "blip".
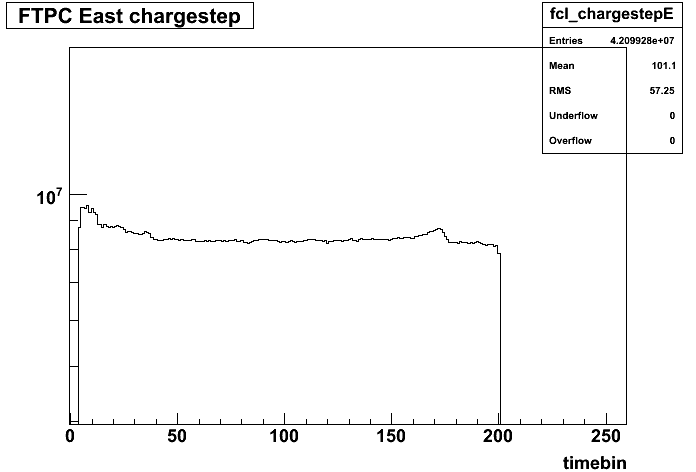 The real chargestep corresponds to the maximum drift time in FTPC East
(clusters from inner radius electrode) and is located near 170 timebins.
This position will change slightly with atmospheric pressure. The hits
beyond the step at timebin 170 are due to electronic noise and pileup. This step
should always be visible even if it is only a "blip".
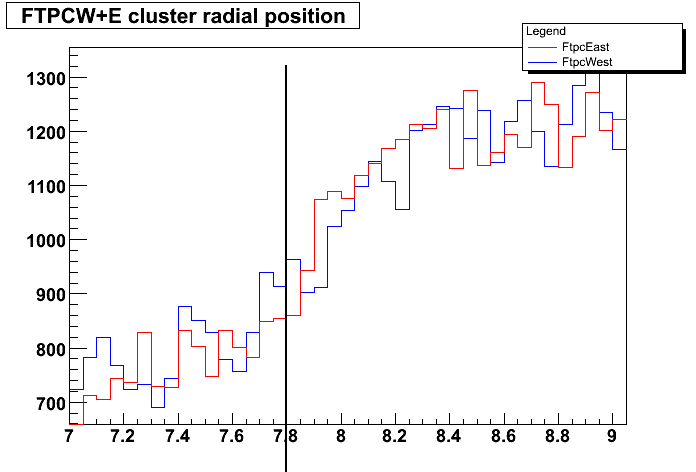 The cluster radial position histogram for FTPC East(red) and FTPC West(blue) should show the radius step at the inner radius (~7.8 cm). If the temperature and pressure corrections applied to the FTPC drift maps are correct, the inflection point of the distribution of cluster radial positions will coincide with the black vertical line at 7.8 cm.
Deviations of more than 1mm (2 bins) should be reported.
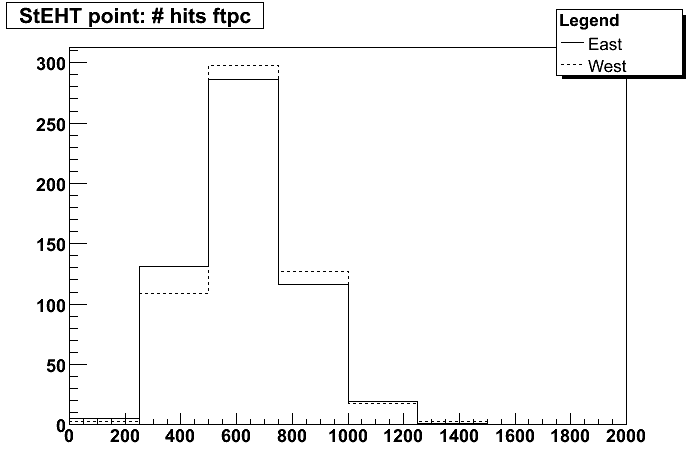 Distribution of number of reconstructed space points in
FTPC East (solid line) and West (dashed line). Should have
similar means and widths; scales with centrality,
depends on multiplicity cut for this set of plots
(i.e. low, medium or high).
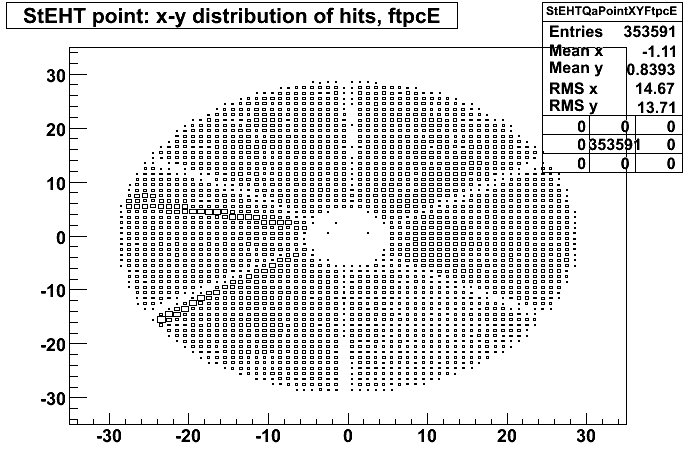 Radial distribution of reconstructed space points in FTPC East.
The distribution should be uniform except for the insensitive gaps
between the readout sectors. Localized denser areas are due to noise.
Ideally noisy pads are flagged in the FTPC gain tables so that they
are not used for cluster finding. Less densely populated areas
not on the sector boundaries are due to dead electronics. Empty areas
not on the sector boundaries indicates a serious hardware problem. An
FTPC expert should be contacted immediately if this is seen in
fast offline-QA during data taking.
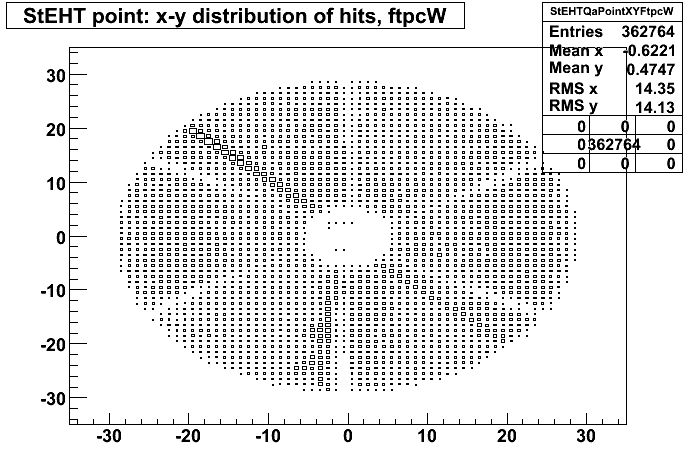 Radial distribution of reconstructed space points in FTPC West.
The distribution should be uniform except for the insensitive gaps
between the readout sectors. Localized denser areas are due to noise.
Ideally noisy pads are flagged in the FTPC gain tables so that they
are not used for cluster finding. Less densely populated areas
not on the sector boundaries are due to dead electronics. Empty areas
not on the sector boundaries indicates a serious hardware problem. An
FTPC expert should be contacted immediately if this is seen in
fast offline-QA during data taking.
 Number of reconstructed space points assigned to
tracks in FTPC East (solid line) and West (dashed line) in each
padrow. The horizontal axis shows padrow numbers
where FTPC-West is 1-10 and FTPC-East is 11-20. Padrows
#1 and #11 are closest to the center of STAR. East and West should
be similar in shape and magnitude.
Spikes indicate noisy electronics; dips indicate dead electronics.
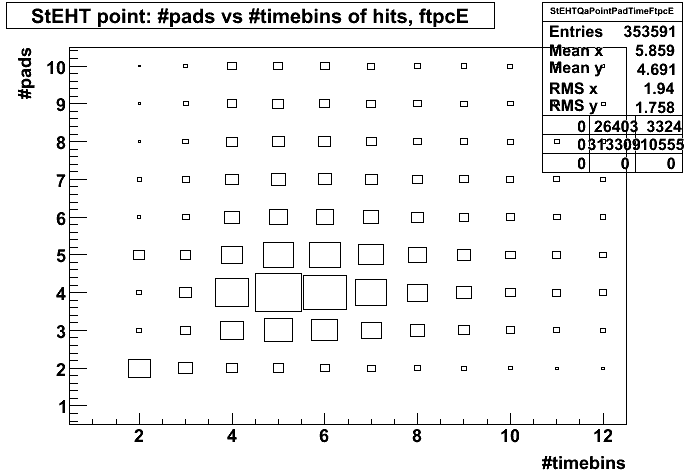 Monitors the cluster quality in FTPC East. Ideally the
clusters should have a pad length of 3-5 and a
timebin length of 4-6. A prominent peak located at (2,2) indicates bad gas or loss of gain or electronic noise. An FTPC expert should check the analogous plots for points on tracks (St*QaGtrkPadTimeFtpcE/W). If the peak at (2,2) is not prominent in these plots, it was caused by noise.
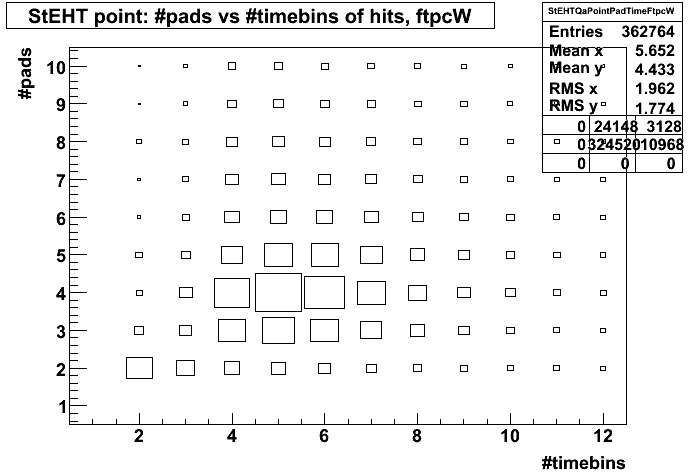 Monitors the cluster quality in FTPC West. Ideally the
clusters should have a pad length of 3-5 and a
timebin length of 4-6. A prominent peak located at (2,2) indicates bad gas or loss
of gain or electronic noise. An FTPC expert should check the analogous plots for points on tracks (St*QaGtrkPadTimeFtpcE/W). If the peak at (2,2) is not prominent in these plots, it was caused by noise.
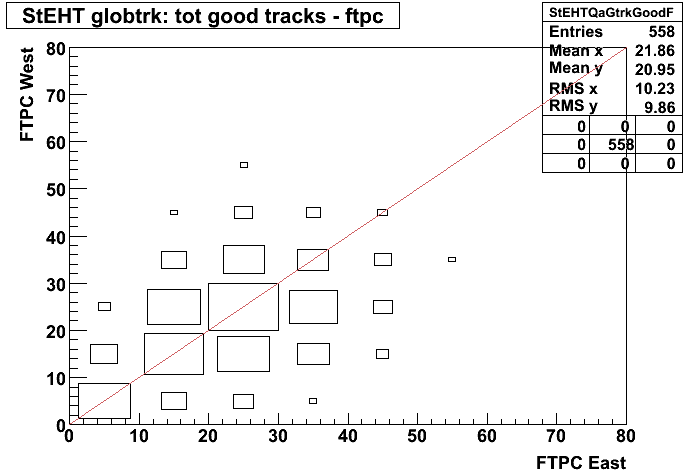 Scatter plot of good global track multiplicities in FTPC West
versus FTPC East. Distribution should be correlated and lie
along the diagonal reference line. Magnitudes and widths depend on
trigger condition and multiplicity cut for this
set of plots (i.e. low, medium or high).
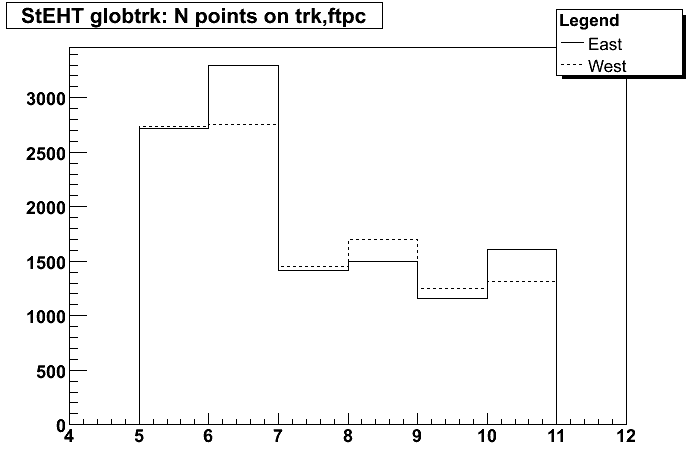 Distribution of the number of fitted points on track
for FTPC-East (solid line) and FTPC-West (dashed line)
global tracks. Distributions should be similar within
statistics and peak at 10.
For year 2006 data, the peak at 6 is due to pileup.
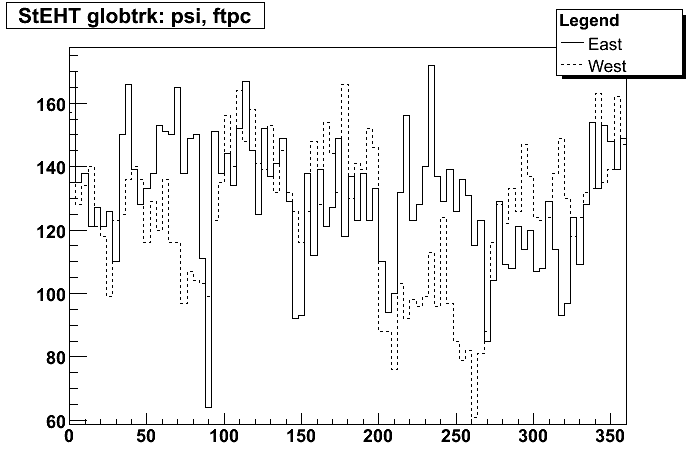 Azimuthal distributions for track direction angle (psi) for
FTPC-East (solid line) and FTPC-West (dashed line) global tracks.
These should be similar and flat within statistics except for dips at
30,90,150,210,270 and 330 degrees due to the hexagonal FTPC sector structure.
Other holes indicate dead electronics. (Note that this plot is zero suppressed)
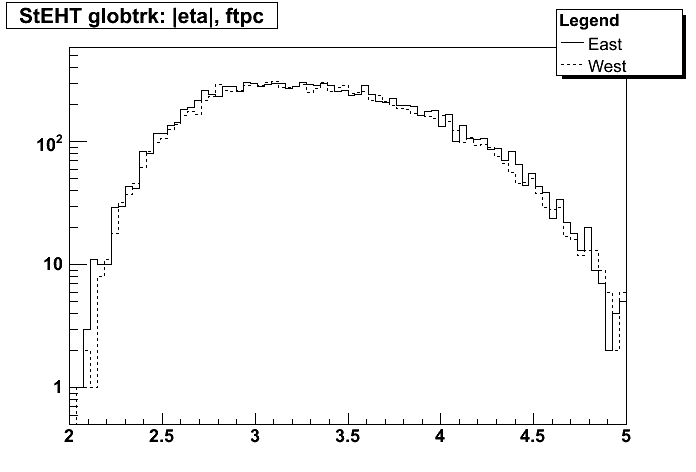 Distributions of absolute value of pseudorapidity for
FTPC-East (solid line) and FTPC-West (dashed line) global tracks.
These should be similar within statistics and range from about
2.5 to 4.
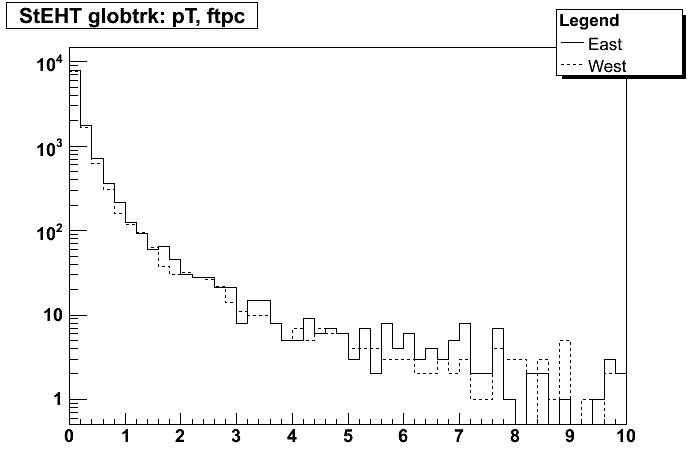 Transverse momentum (GeV/c) distributions for
FTPC-East (solid line) and FTPC-West (dashed line) global tracks.
These should be similar within statistics.
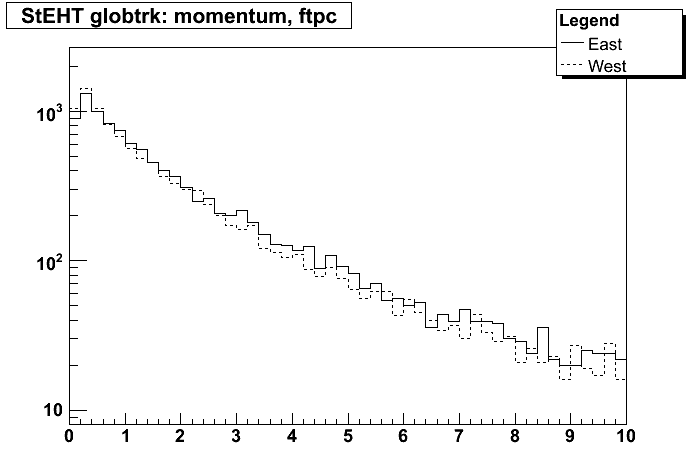 Total momentum (GeV/c) distributions for
FTPC-East (solid line) and FTPC-West (dashed line) global tracks.
These should be similar within statistics.
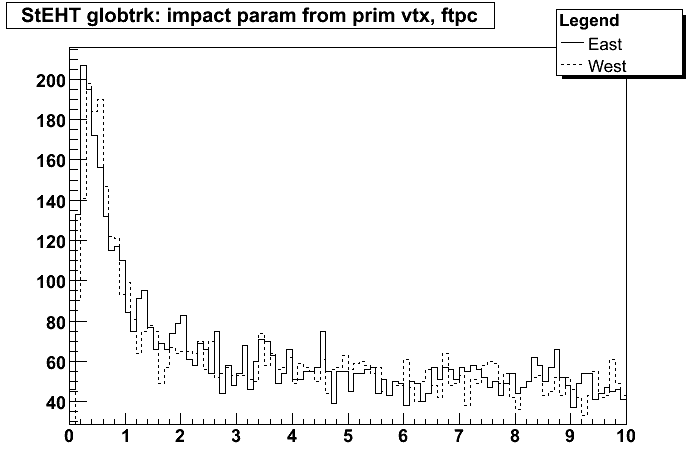 Impact parameter (in cm) from primary vertex for
FTPC-East (solid line) and FTPC-West (dashed line) global tracks.
These should be similar within statistics.
 Scatter plot of (x,y) coordinates for the first fitted
space points on FTPC-East global tracks.
The plot should be uniformly populated
with hits; the FTPC hexagonal structure is visible.
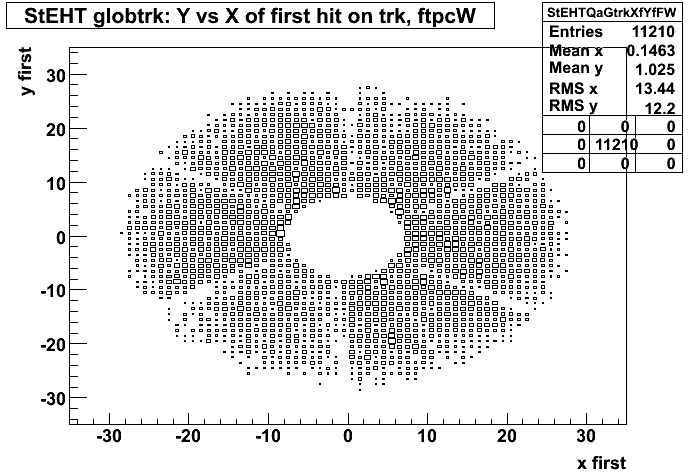 Scatter plot of (x,y) coordinates for the first fitted
space points on FTPC-West global tracks.
The plot should be uniformly populated
with hits; the FTPC hexagonal structure is visible.
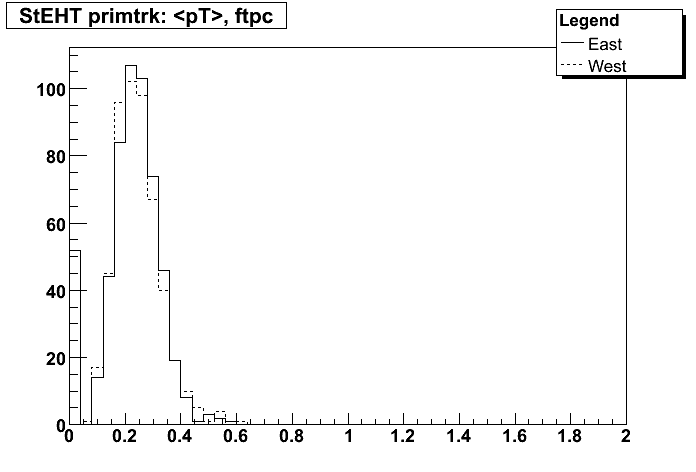 Mean transverse momentum distribution for FTPC-East (solid line)
and FTPC-West (dashed line) primary tracks. These should be
similar within statistics and peak between 0.2 - 0.4 GeV/c.
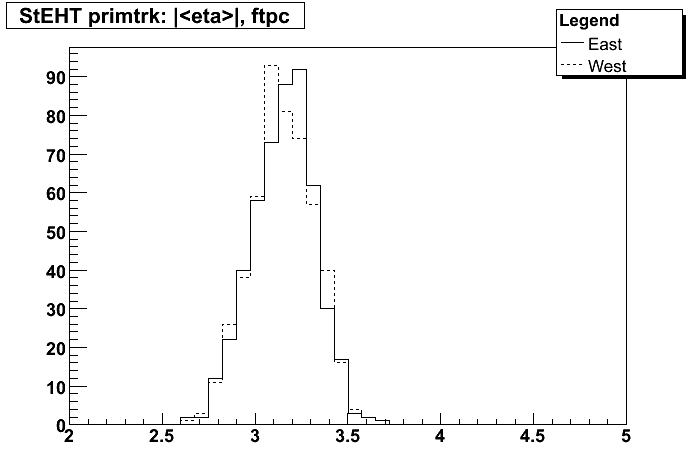 Distribution of absolute value of mean pseudorapidity for FTPC-East
(solid line) and FTPC-West (dashed line) primary tracks.
These should be similar within statistics and peak
around 3 - 3.5, provided that the event vertex distribution is
centered at z=0.0.
 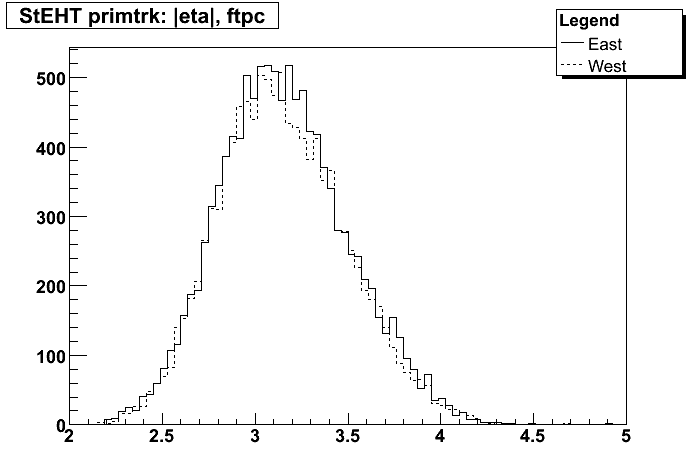 Distributions of absolute value of pseudorapidity for
FTPC-East (solid line) and FTPC-West (dashed line) primary tracks.
These should be similar within statistics and range from about
2.5 to 4.
 Transverse momentum (GeV/c) distributions for
FTPC-East (solid line) and FTPC-West (dashed line) primary tracks.
These should be similar within statistics.
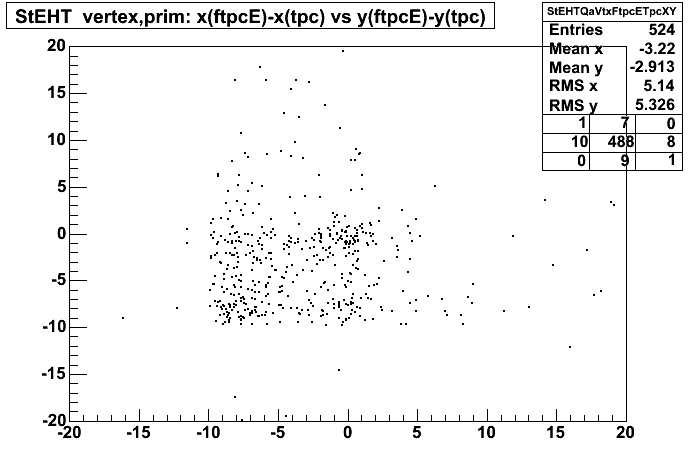 Difference between x,y position of primary vertex reconstructed from tracks in FTPC East
and tracks from TPC. Ideally the distribution should peak at 0,0
Any significant deviation indicates a calibration problem and
should be reported.
 Difference between z position of primary vertex reconstructed from tracks in FTPC East
and tracks from TPC. Ideally the distribution should peak at 0.
Any significant deviation indicates a calibration problem (t0 and/or
temperature corrections) and should be reported.
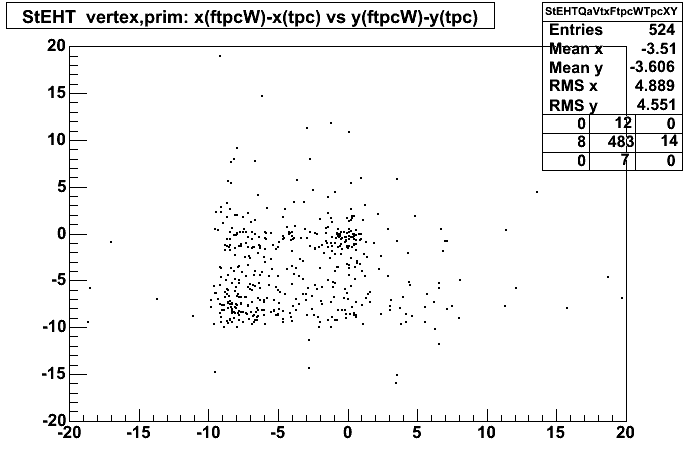 Difference between x,y position of primary vertex reconstructed from tracks in FTPC West
and tracks from TPC. Ideally the distribution should peak at 0,0
Any significant deviation indicates a calibration problem and
should be reported.
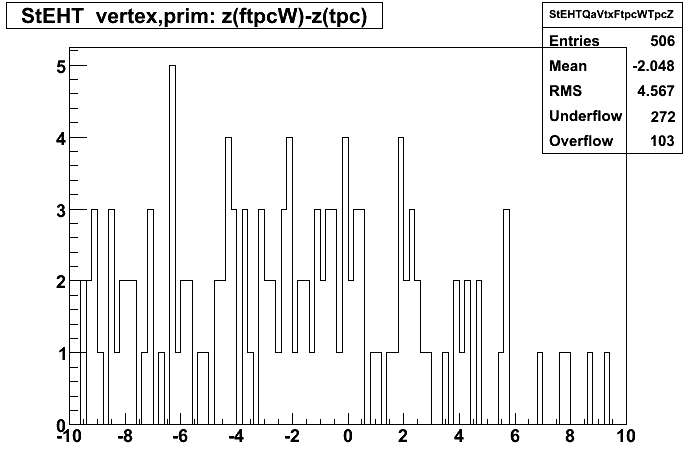 Difference between z position of primary vertex reconstructed from tracks in FTPC West
and tracks from TPC. Ideally the distribution should peak at 0.
Any significant deviation indicates a calibration problem (t0 and/or
temperature corrections) and should be reported.