Fig 1. The Main control window. Opening a data file
So onto how to use it type the following commands on a rcas machine at BNL:
Two windows should pop up. The one labeled "On Line Monitor" is your control panel. Its shown in Fig. 1 below. To open a data file click on "control" and then open data file, also shown in Fig. 1 below. Mostly you can ignore what gets printed to the terminal window, unless you want to report an error then its useful to let Marcelo know what was printed.

Fig 1. The Main control window. Opening a data file
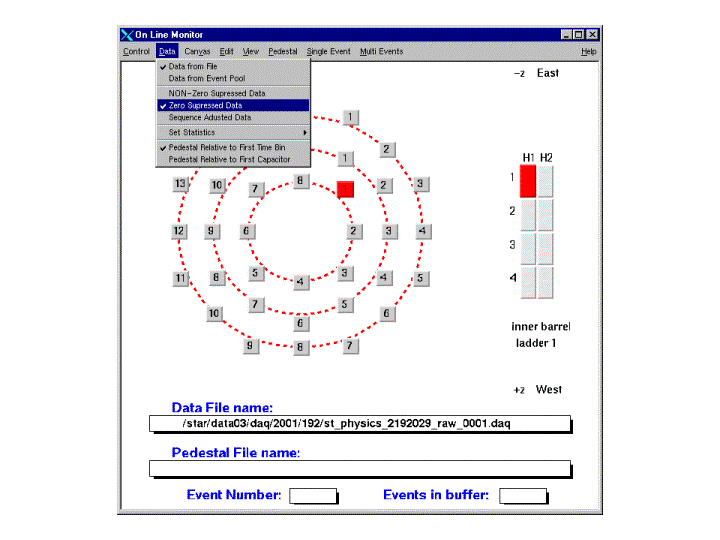
Click your way to the data file you want in the window that pops up. The first event of this file will also be read in. You now need to "inform" the code what kind of data you are looking at. You can pick between " zero-suppressed, non-zero-supressed and Sequence adjusted". Mostly you will be looking at zero-supressed data so this is the default. Zero Supressed is how the raw data gets written out. Only for debugging purposes is the data written out non-zero supressed. These options lie in the "Data" menu. Shown in Fig 2.

Fig 2. Selecting the data type
Most of the SVT data files are in
/star/data03/daq/svt/2001/Bon
                          Boff
                          Injector
                          NoiseTests
                          Pedestal
                          raw
in sub-directories of their run numbers
Also shown in the window is a graphic display of the SVT barrels and ladder. Highlighted in red is the ladder for which the data currently being displayed and the Hybrid of that ladder. By clicking in the grey buttons you can select different ladders and hybrids to view. In Fig 2 Ladder 1 hybrid 1 Wafer 1 has been selected.
If you want to look at pedestal data you need to select the "Get Pedestal fron DAQ file" option shown in Fig 3.

Fig 3. Reading in a pedestal file
Most of the other menu options are (hopefully) self descriptive so click away. Some of the most useful options are:

Fig 4. Example raw ADC and ADC - Andoe vs Time plots