Field Off Studies
Looking at Run st_physics_2203041_raw. In Sequence and hit finding T0=6, m_thresh_lo = 5+mPedOffSet; m_thresh_hi = 15+mPedOffSet; m_n_seq_lo = 2; m_n_seq_hi = 0; m_inv_prod_lo = 8. Common mode noise subtraction is done if >20 anodes remained after the online pedestal subtraction and ASIC sequence finding. No bad anodes are eliminated, the RMS of the noise is assumed to be 2.1

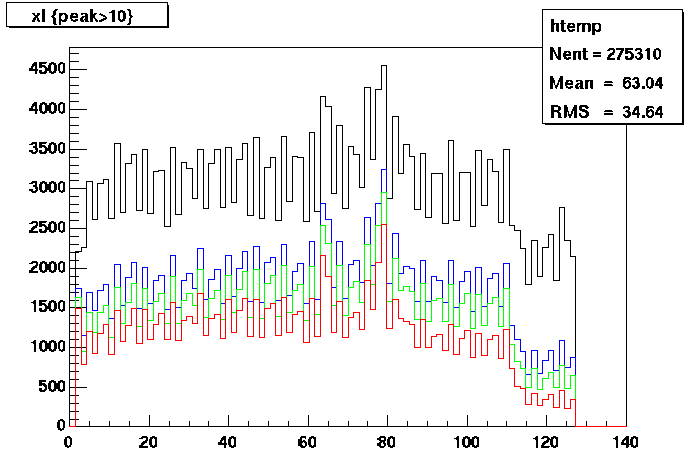
Fig 1
Figure 1 was acutally made with m_thresh_hi=10. What is plotted is the number of hits found at a given timebin over 150 events and all hybrids. The black line is all hits found. The blue line all hits with a peakADC > 13, the green peak ADC>15 and redd peakADC>20. What you can see is that by increasing the peakADC cut up to 15 you appear to be removing noise but not signal. I deduce this because I am removing hits evenly over all the drift region. If you were removing hits I would expect to preferentially remove hits at long drift where the hits are most diffuse and indeed you can see this in the red plot where I seem to be removing fractionaly more hits after timebucket=80 than before. So I think a m_thresh_hi cut of 15 ADC counts is our best bet for increasing signal to noise.
What else this plot shows is that the longest drift time for real hits is 110 after that there is a large step down to many fewer hits. In the black histogram you can also see the step up for where the true t0 is. This would seem to be at timebucket 4. So from that we can deduce an average drift velocity of 3*25000000/(110-4) = 0.7E6. Which seems reasonable!
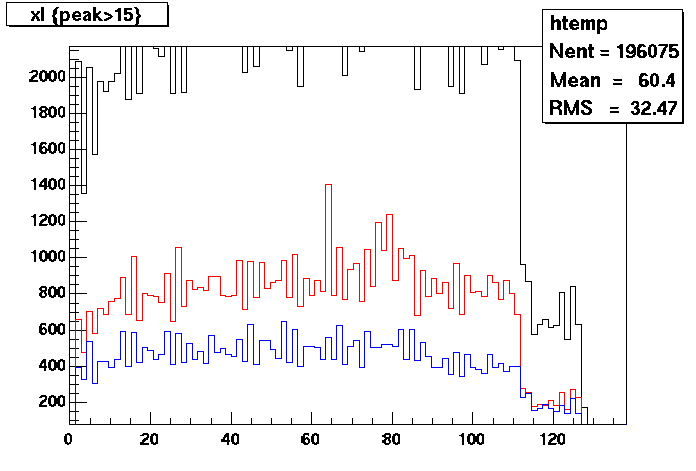
Looking at the slow controls you can see that there is quite a temperature difference between the air/water going in and the air/water coming out. So the question arises does this temperature gradient show up in the drift velocity of the wafers. So I look at the timebucket distribution for wafers 1 and 2 (i.e. East most) and wafers 6 and 7 (i.e. West most) with peak ADC > 15. You can see this plot in Fig.2. I would say that the distributions are the same to within one timebucket in their rising and falling edges.
 Fig 2. East/West Drift Velocity. East==Red, West==blue, All==Black
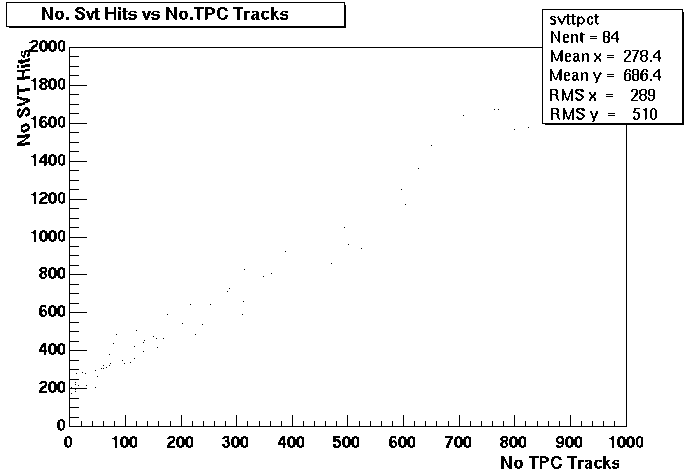
Fig. 3 shows the correlation between the number of hits found with flag < 4 (i.e. good) and the number of tracks found in the TPC. There is a nice strong liniear correlation (good).

Fig 3.
Events are considered if the -20cm .lt. primary vertex z .lt. 20. Only primary tracks are considered if they have a flag .gt. 0. Hits are considered if they have a flag < 4
Helen Caines
Last modified: Tue Aug 21 12:18:31 EDT 2001


 Fig 2. East/West Drift Velocity. East==Red, West==blue, All==Black