| STAR home | |
| STAR TPC: Signal Division between Pad Rows | |
| Maintenance | |
| Last modified: 15:10 Thursday 30-March-2000 | |
A cluster of charge deposited in the TPC drift volume at (X,Y,Z), always yields a signal on more than one pad row, both due to the transverse diffusion that spreads the electrons across multiple anode wires, and to the finite width of the charge distribution induced on the pad plane by each wire. In estimating these effects, drift lines will be assumed to be parallel to Z for simplicity.
There are several implications of the signal correlations between rows:
The following approximate values for transverse diffusion in P10 were used in the simulations for this study:
(Tesla) |
(cm^0.5) |
Sigma after 210-cm Drift (cm) |
Diffusion can have effects somewhat beyond the range that the values in this table might seem to imply: hits in the STAR TPC will have a large dynamic range, and a hit with a large energy deposit will affect a hit with a small energy deposit at greater distance than for two with similar energy depositions. The table below shows the effect.
Count Effect (sigma) | |
In general, the range of the effect is about 3 sigma, so we will use this as a rule of thumb to find the range of the effect at zero and maximum drift length from diffusion alone. Since the anode wires are spaced at 0.4 cm, we can also estimate the number of wires that have to be considered for an electron cluster.
(Tesla) |
(cm) |
|
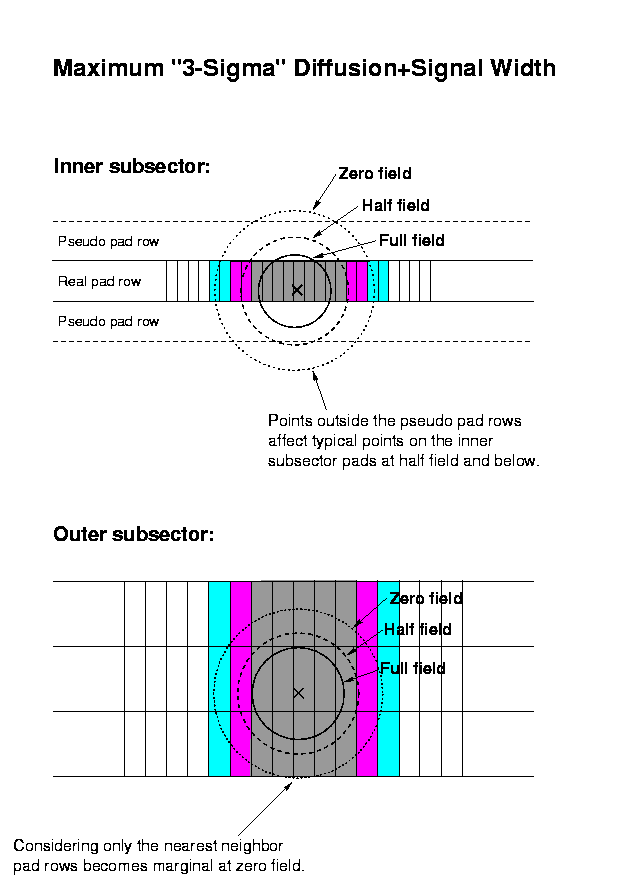
To find the "3-sigma" range of the signal on the pad plane in centimeters, we must also include the width of the charge distribution induced by an anode wire (~0.161 cm for the inner subsector and ~0.323 cm for the outer subsector). We calculate the range of the effect for zero and maximum drift length. Note that, at maximum drift length and low B field, the range can exceed the pad-row pitch: to fully simulate effects due to the large dynamic range of signal, one may need two pseudo pad rows, rather than one, on either side of a real pad row.
(Tesla) |
Inner Subsector (cm) |
Outer Subsector (cm) |

Fig. 1: Maximum "3-sigma" area that a typical pad location
influences, and is influenced by,
due to transverse diffusion and the width of the charge distribution
induced on the pad plane.
The grey, magenta and cyan-colored pads show the approximate range
of the influence at
full, half and zero field, respectively, for the pads marked with X's.
The estimated anode-wire couplings are given as the fraction of a wire's signal induced on the pad row centered beneath Wire #0 --- the "reference" pad row --- relative to that induced on the pad plane as a whole. A wire induces a significant signal only on the pad row beneath it --- the "dominant" pad row --- and its nearest neighbors. Treating the coupling to any other row as identically zero is an excellent approximation. Wires are spaced on 0.4-cm centers, with symmetry around the pad row middle.
Inner subsector pads are pitched at 1.2 cm in Y and have 3 wires over each pad row. To preserve symmetry and unitarity, the coupling f(i) of each wire i to the reference pad row obeys the relations:
Sum f(i) = 3
f(i) = f(-i)
f(i) + f(i-3) + f(i+3) = 1
Outer subsector pads are pitched at 2.0 cm in Y and have 5 wires over each pad row. The coupling f(i) of each wire i to the reference pad row obeys the relations:
Sum f(i) = 5
f(i) = f(-i)
f(i) + f(i-5) + f(i+5) = 1
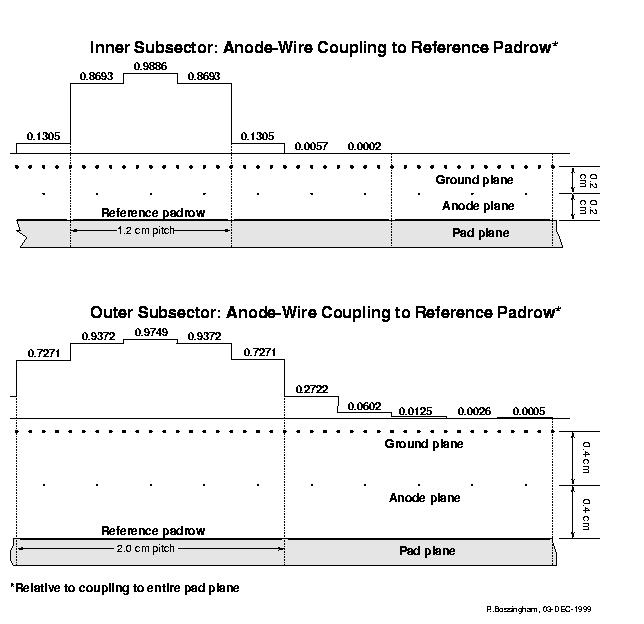
Fig. 2: Fraction of the signal from nearby anode wires induced
on the reference pad row
(relative to that induced on the pad plane as a whole) for the STAR TPC.
For charge clusters having the same size and values of X and Y, the signal fraction induced on neighboring rows will be larger for longer drift distances and for lower magnetic fields (due to transverse diffusion). These dependencies are clearly visible in Figs. 3, 4 and 5 (for which the initial charge was distributed uniformly in Y across the reference pad row). The Z (drift-length) dependence is more pronounced for the inner subsector because of its smaller ratio of pad-row pitch (1.2-cm, rather than 2.0-cm) to transervse-diffusion width.
Note that, for the inner subsector, "nearest neighbors" refers to pseudo pad rows, not the real ones at considerable separation. Any meaningful simulations must include at least one set of pseudo pad rows bracketing each real row, but one can see from Fig. 5, that, for the inner subsector at low magnetic fields, a second pair is also needed (but not currently implemented in GSTAR).

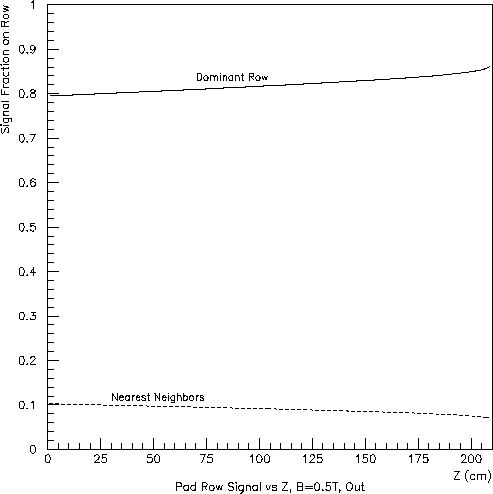
Fig. 3: Inner subsector (left) and outer subsector (right) at full field
(B=0.5 T):
signal fraction appearing in the dominant pad row and each nearest
neighbor vs. Z.
The calculation assumed uniform charge deposition above the dominant
pad row at each Z and a transverse diffusion constant of 0.0225 cm^0.5.
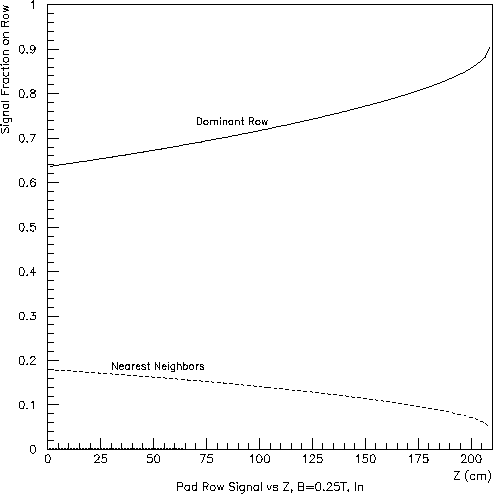
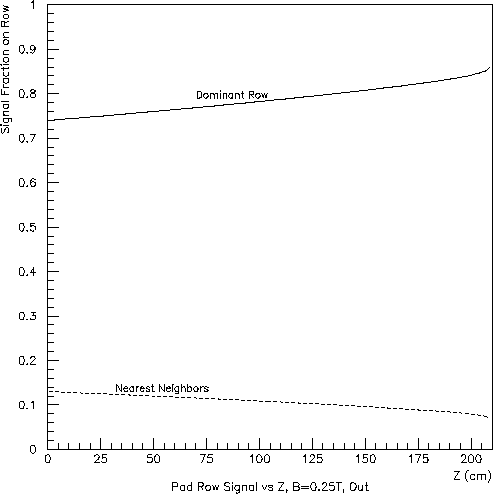
Fig. 4: Inner subsector (left) and outer subsector (right) at half field (B=0.25 T):
signal fraction appearing in the dominant pad row and each nearest
neighbor vs. Z.
The calculation assumed uniform charge deposition above the dominant
pad row at each Z and a transverse diffusion constant of 0.0355 cm^0.5.
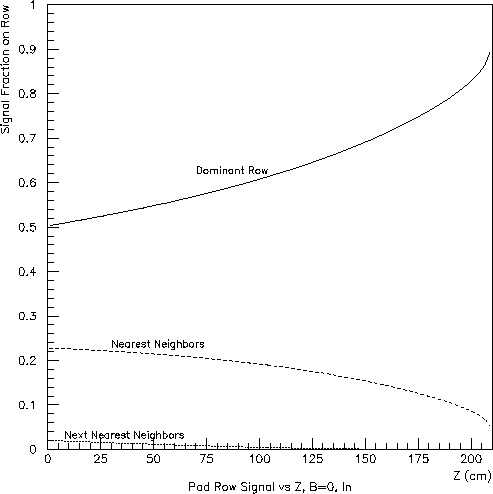

Fig. 5: Inner subsector (left) and outer subsector (right) at zero field:
signal fraction appearing in the dominant pad row and each nearest
neighbor vs. Z.
The calculation assumed uniform charge deposition above the dominant
pad row at each Z and a transverse diffusion constant of 0.0540 cm^0.5.
Next, consider the Y-dependence of the "coupling" between hits in neighboring pad rows. The ratios of the signal on the nearest neighbor, to that on the dominant, pad row versus Y/(pad length) are shown in Figs. 6, 7 and 8. Here, Y=0 refers to the center of the dominant pad row. Clearly, the ratio will be 1.0 for Y/(pad length)=0.5, when the charge is half-way between two pad rows (or, for the inner subsector, between a real and pseudo pad row.
While no serious calculation has been done (to my knowledge), Figs. 6, 7 and 8 give some idea as to the Y resolution available for hits from tracks traveling along a pad row in the outer subsector. Recalling that the pads provide X information at a 20:1 signal:noise ratio, the Y resolution would probably be at the level of one-tenth pad length.
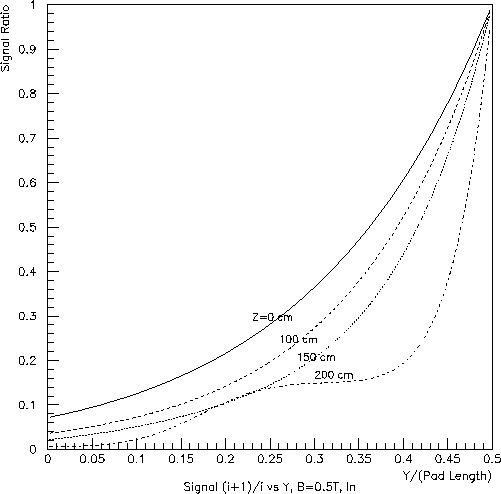
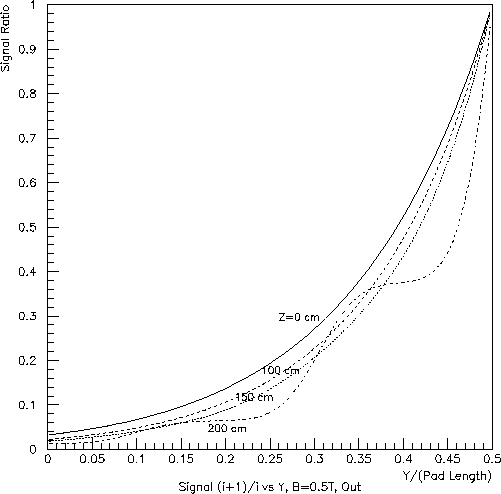
Fig. 6: Inner subsector (left) and outer subsector (right) at full field
(B=0.5 T):
ratio of the nearest-neighbor pad-row signal to the dominant pad-row
signal vs. position
as a fraction of the pad length.
The calculation assumed a transverse diffusion constant of 0.0225 cm^0.5.
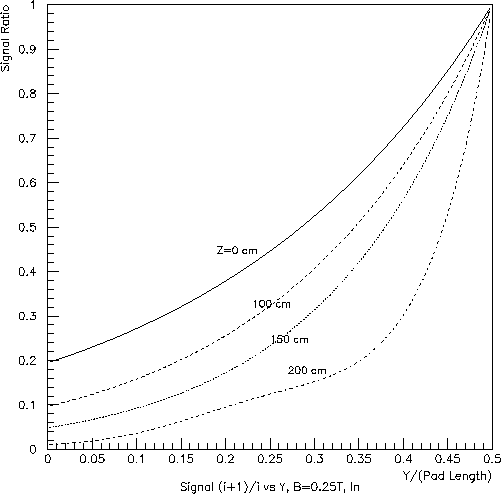
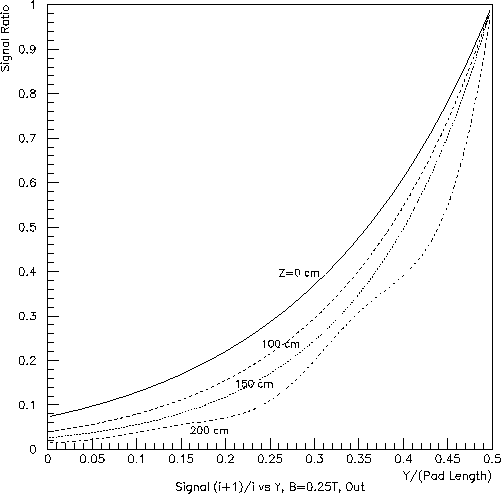
Fig. 7: Inner subsector (left) and outer subsector (right) at half field
(B=0.25 T):
ratio of the nearest-neighbor pad-row signal to the dominant pad-row
signal vs. position
as a fraction of the pad length.
The calculation assumed a transverse diffusion constant of 0.0355 cm^0.5.

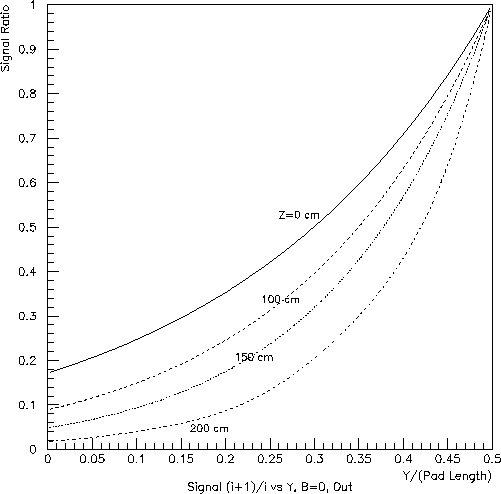
Fig. 8: Inner subsector (left) and outer subsector (right) at zero field:
ratio of the nearest-neighbor pad-row signal to the dominant pad-row
signal vs. position
as a fraction of the pad length.
The calculation assumed a transverse diffusion constant of 0.0540 cm^0.5.