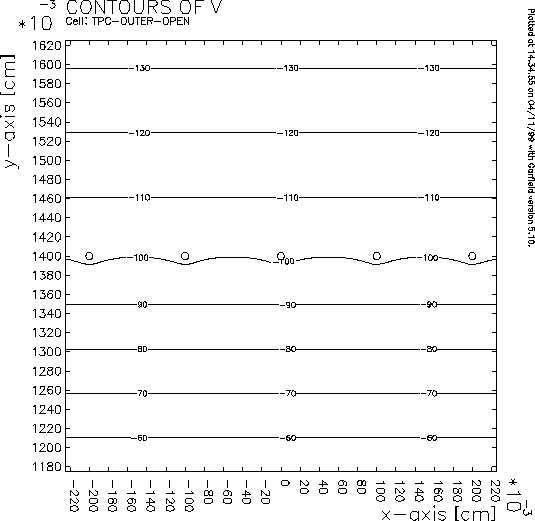
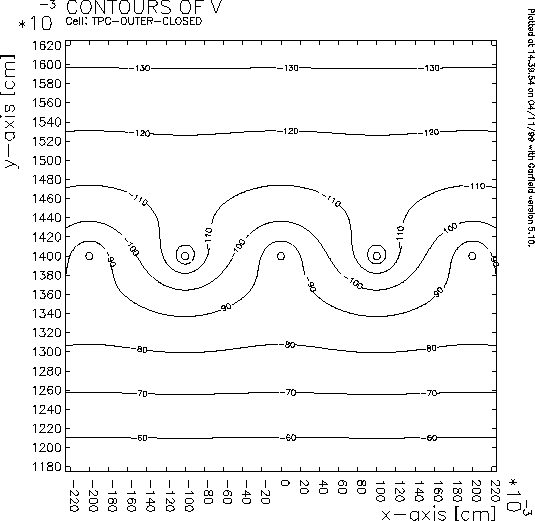
The gating-grid electrostatics for the inner and outer subsectors are almost identical with the 1998-1999 operating voltages. Most of the plots here are for the outer subsector, but results for the inner subsector are similar.
All wires in the gating grid are at the same potential when it is open, and nearby equipotentials are almost flat. The gating grid was closed (1998-1999) by shifting the voltages on alternate wires up or down symmetrically, leaving the average potential unchanged. Therefore, opening and closing should only affect the fields nearby. The choice of alignments with respect to the anode wires was not necessarily chosen consistently; this should make no appreciable difference.


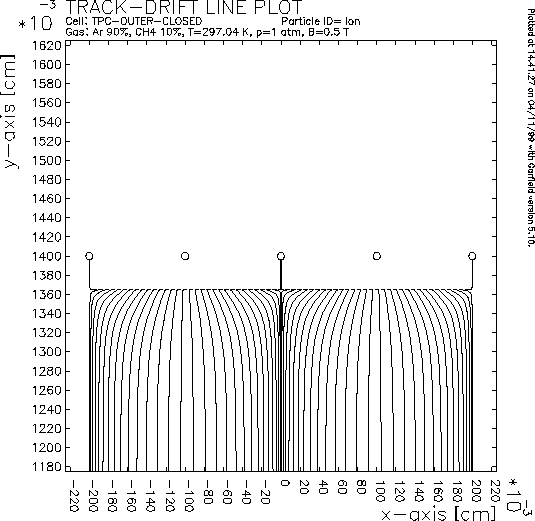
Equipotentials around the outer subsector gating grid at y=1.4 cm when it is open (left) and closed (right). (The coordinate system is Garfield-related.)
When open, the gating grid transparency is essentially 100% for electrons coming from the drift volume, but considerably smaller for ions drifting away from the anode wire. This is seen in the plots below. Of 200 ions started uniformly around the anode wire in the simulation, only 8 escape into the drift volume. However, in the real TPC for low to moderate gains, the avalanche is expected to be relatively narrow, with most ions being produced close to the drift lines approaching the anode wires. Therefore, fewer ions are expected to go toward the pad plane, and more ions are expected to go toward the ground wires.
Closing the gating grid adds transverse electric field components to the longitudinal field, and the field lines from the TPC drift region terminate on grid wires. The gating grid is then opaque in both directions.

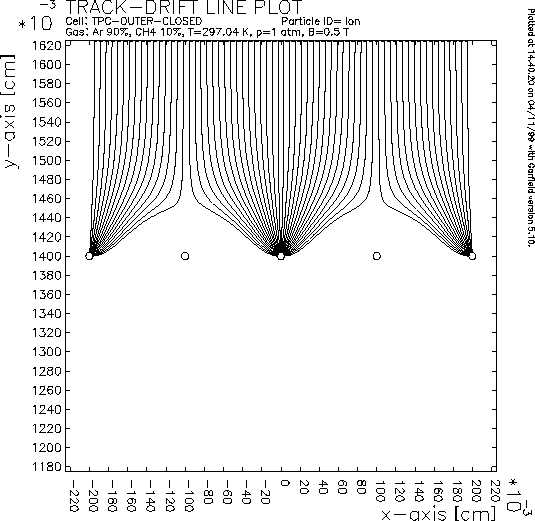
Drift from the TPC drift volume of P10 to the outer subsector gating grid at y=1.4 cm when open (left) and closed (right). (The coordinate system is Garfield-related.)
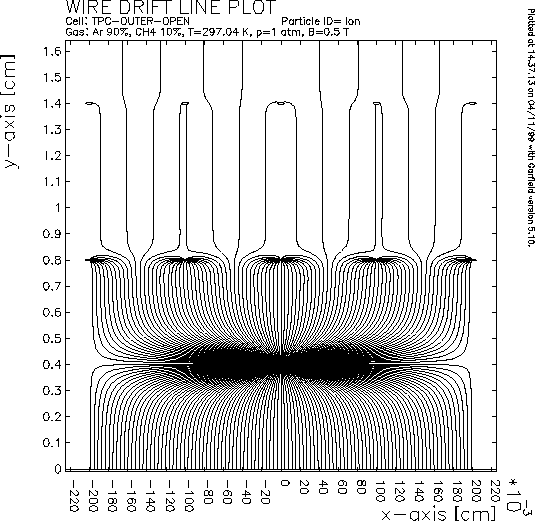
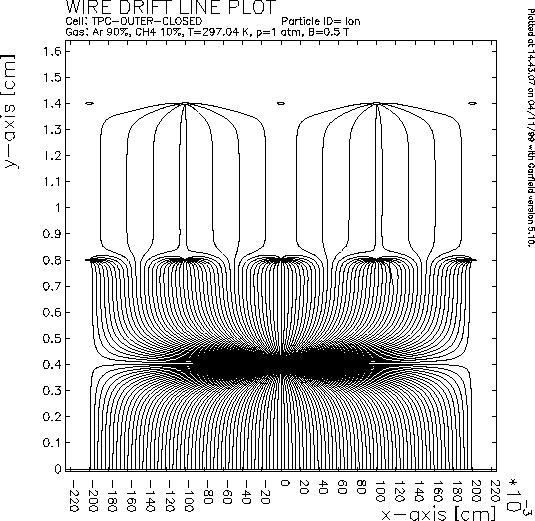
Ion drift in P10 from an outer subsector anode wire to the outer subsector gating grid at y=1.4 cm when open (left) and closed (right). (The coordinate system is Garfield-related.)
Ionization produced in the volume between the gating grid and pad plane is relatively unaffected by the gating-grid state; electrons in this region usually drift to the anode wire with subsequent amplification. Of course, the gating grid doesn't impose a sharp cutoff exactly at its wire plane; drift properties vary on the scale of its wire spacing. As shown in the plots below, the transition from opaque to transparent occurs within a few millimeters.
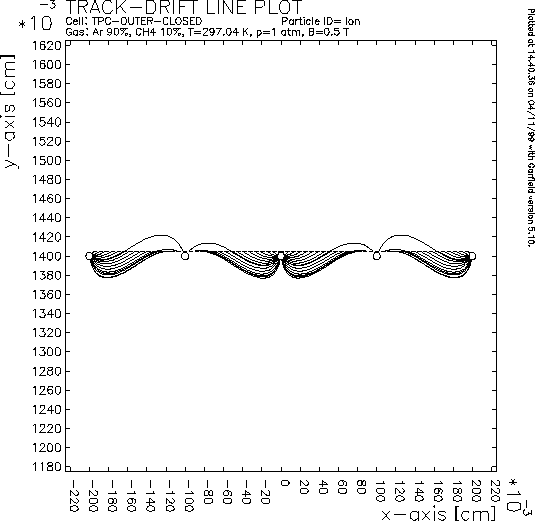
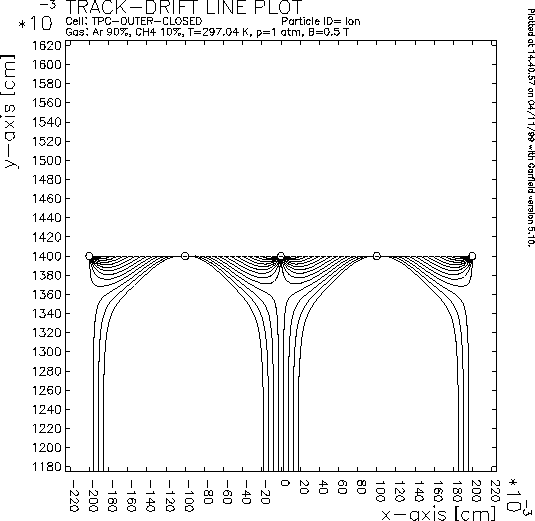
Electron drift in P10 from tracks 0.01 cm outside the gating grid (left) and on the gating grid (right); transmissions are about 0% and 20%, respectively.
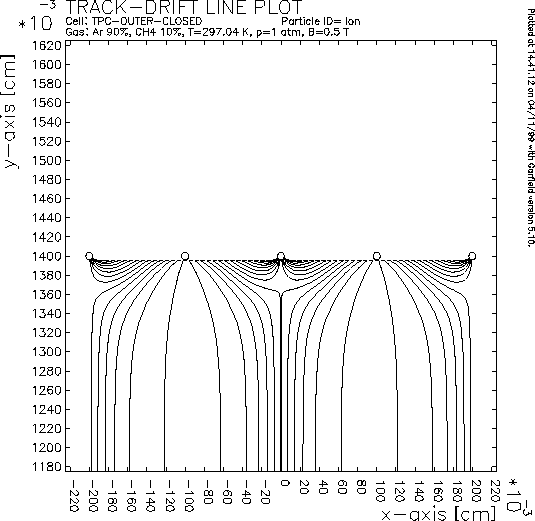
Electron drift in P10 from tracks inside the gating grid by 0.01 cm (left) and 0.035 cm (right); transmissions are iabout 40% and 95%, respectively.
When the gating grid is closed and the TPC is operating as an MWC, the range of electron arrival times at the anode wires in P10 is about 315 ns, or almost 3 RHIC cycles.
The electrons originating between the pad plane and ground wires are only delayed by abut 140 ns, relative to those originating between the ground wires and gating grid. Since this time difference is of the same order as the amplifier shaping time (about 150 ns, FWHM), their signals will not be cleanly separated.
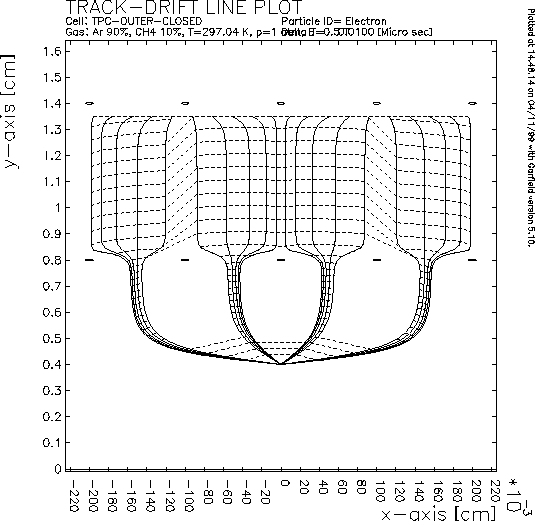
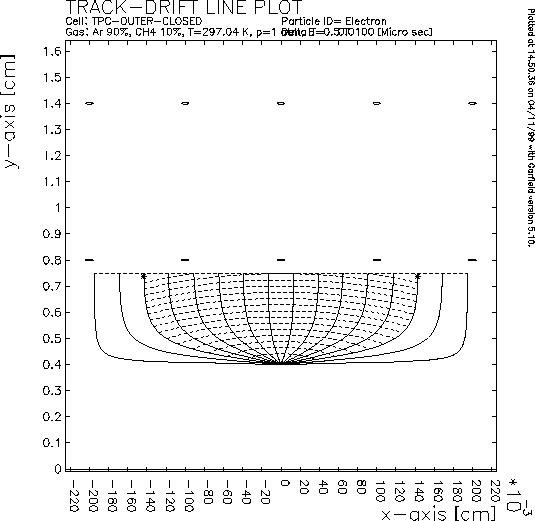
Garfield simulations of electron drift from tracks inside the gating grid by 0.05 cm (left) and inside the ground wire plane by 0.05 cm (right). Isochrones are plotted at 10 ns intervals; graphics limitations prevent all isochrones from being connected.
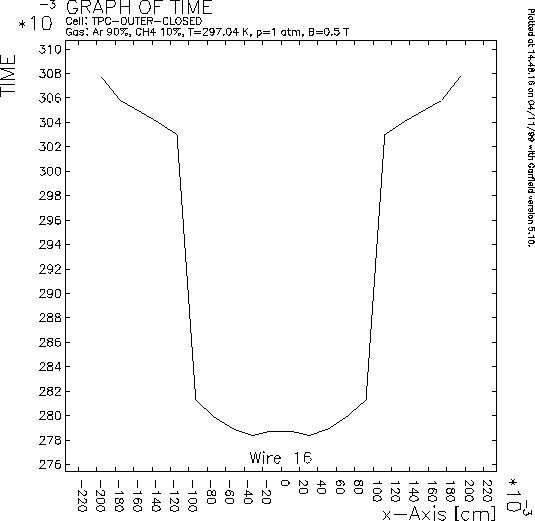
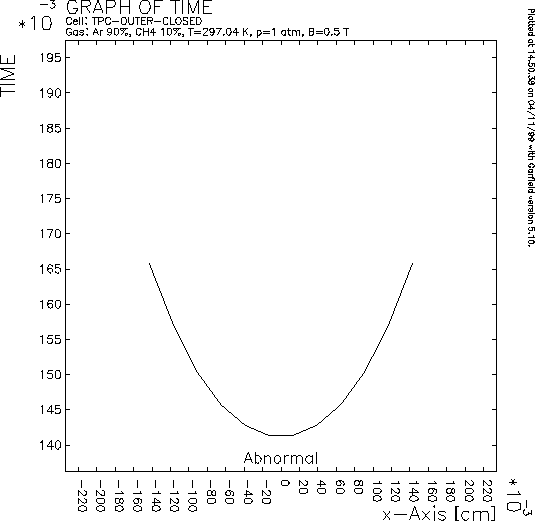
Garfield simulations of electron drift times from tracks inside the gating grid by 0.05 cm (left) and inside the ground wire plane by 0.05 cm (right). Limitations in the code prevented the longer times for drift near the edge of the cell from being plotted.