

Following Jonathan "New pulser view" study I had a look at two series of pulser runs: 610200x series (x=2 -> 10) and 6057x (x=2 -> 22). The goal is to get a relative calibration between the two sides of the detector N and P.
The first study I made on this in end of May was wrong because of a bug in the SsdDaqMaker which was mixing the strips differently for each ladder.
Now this bug has been fixed and using the DEV version of the Ssd code I can analyse all the st_pulser_*_raw.daq files.
First thing I had a look to is which strips are actually fired by the internal a128c pulses. To summarize in one picture all the strips fired I plot the ladder number wrt the (first)strip of a cluster if the cluster has only one strip and if it has an adc count inside the expected range (100 to 150 adc counts for a pulse level of 40, 210 to 370 for a level of 100). The color indicates the occurence of the signal on the strip. So only red ones are the fired strips and blue ones are to be explained (especially when it seems there is a structure). The strip scale is 1 to 128 since I plot he strip number modulo 128 allowing to visualize all the chips of all the wafers at a time.
| Run 6102005 - P side - no offset | Run 6102005 - N side - no offset |
|---|---|
| predicted strips (33, 49, 65, 81) - observed 15 31 33 49 81 111 127 | predicted strips (48, 64, 80, 96) - observed 48 (64) 80 96 |
 |
 |
| Run 6102004- P side - offset=1 | Run 6102004- N side - offset=1 |
| predicted strips (16 32 112 128) - observed (15 31 111 127) | predicted strips (1 17 97 113) - observed (1 17 97 113) |
| Run 6102003 - P side - offset=2 | Run 6102003 - N side - offset=2 |
| predicted strips (34, 50, 66, 82) - observed (15 31 111 127) | predicted strips (47 63 79 95) - observed (2 18 98 114) |
| Obvisouly the wrong offset was stored in the logbook here ! | |
 |
 |
| Run 6102002 - P side - offset=3 | Run 6102002 - N side - offset=3 |
| predicted strips (15 31 111 127) - observed (15 31 111 127) | predicted strips (2 18 98 114) - observed (2 18 98 114) |
| Run 6102006 - P side - offset=29 | Run 6102006 - N side - offset=29 |
| predicted strips (2 18 98 114) - observed (2 18 98 114) | predicted strips (15 31 111 127) - observed (15 31 111 127) |
| Run 6102007 - P side - offset=30 | Run 6102007 - N side - offset=30 |
| predicted strips (48, 64, 80, 96) - observed (48 80 96) | predicted strips (33 49 65 81) - observed (33 49 81) |
| Run 6102008 - P side - offset=31 | Run 6102008 - N side - offset=31 |
| predicted strips (1 17 97 113) - observed (1 17 97 113) | predicted strips (16 32 112 128) - observed (16 112) |
| Run 6057003 - P side - offset=8 | Run 6057003 - N side - offset=8 |
| predicted strips (37 53 69 85) - observed (37 53 69 85) | predicted strips (44 60 76 92) - observed (44 60 76 92) |
 |
 |
Comments:
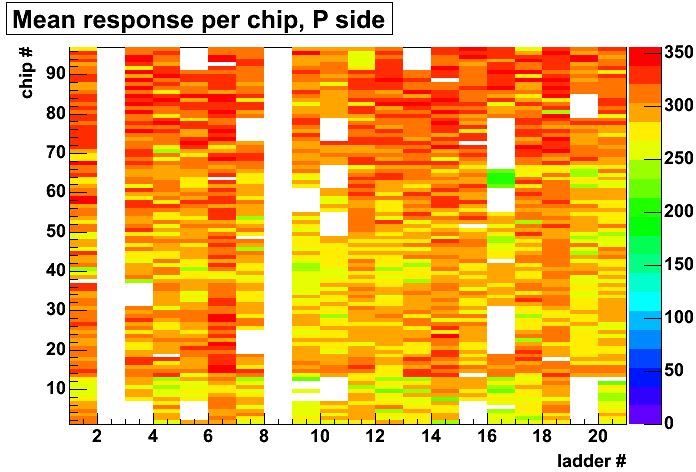
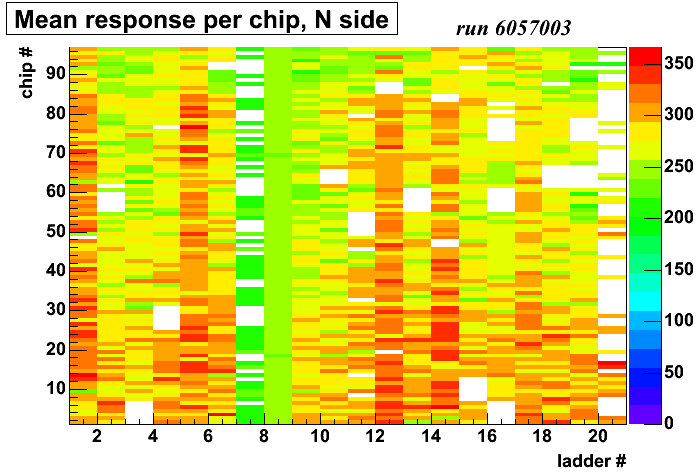
Now I try to obtain the mean response of each chip. For this, I compute the mean and rms of the signal of the expected fired strips for each chip in the expected adc counts range.
Here is a plot of the data used for run 6057003, ladder 3, wafer 10, chip 5 (or 59) for P side and wafer 7, chip 1 (or chip 38) for N side:
| Run 6057003 - P side - chip 59 | Run 6057003 - N side - chip 38 |
|---|---|
 |
 |
One question is wether we compute a ratio per wafer or per chip. Let's look at the rms of the signal distribution inside a wafer or a chip.
| RMS per chip - P side | RMS per chip - N side |
|---|---|
 |
 |
| RMS per wafer - P side | RMS per wafer - N side |
 |
Comments:
Here is the mean response to the pulse for each chip.
| P side | N side |
|---|---|
 |
 |
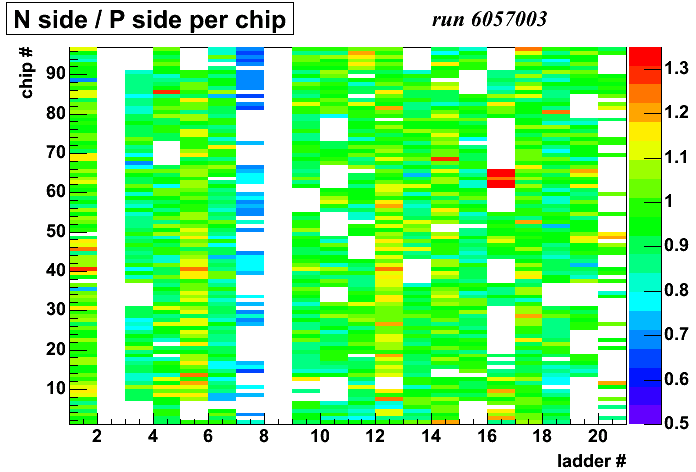
And then the ratio itself. Here I assume that chip n (1->96) of side P (that is chip c of wafer w where n = (w-1)*6+c) faces chip 97-n of side N (that is chip 7-c of wafer 17-w where 97-n = (17-w-1)*6+7-c).

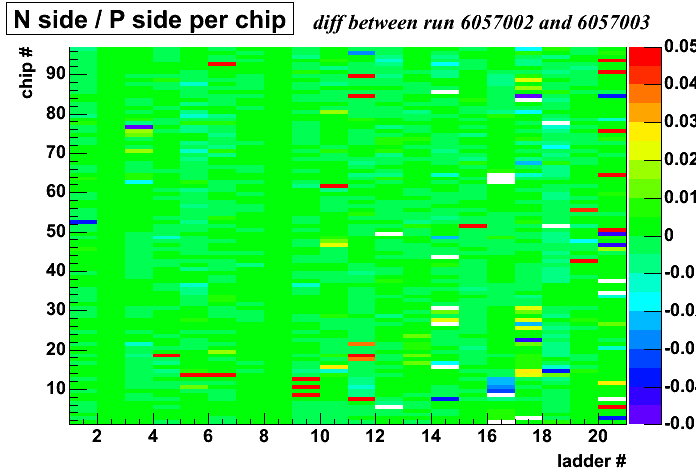
Just to be sure, I make the difference of this ratio for two different runs: 605703 and 605702:

The difference is almost always below 5%.
Comments:
To allow direct comparison with other results, here are the printout of the values for all ladders, wafers and chips.