Copmarison of results with Jerome
first results and method used
This is to describe how I calculate the charge ratio of the pulser.
For each A128 ,we have ,on both sides , 4 strips max of fired.
This example is for the first A128 of wafer 1 of the ladder 1.
The file used is the run pulser 6057008
|
For side P.
|
For side N.
|

|

|
As you can see , we don't have exactly 4 strips fired on both sides because of the status of the strip(level of noise ,pedestal)
In order to choose the goods strips which are normaly fired by the pulser ,I look on ADC vs IdStrip to do it
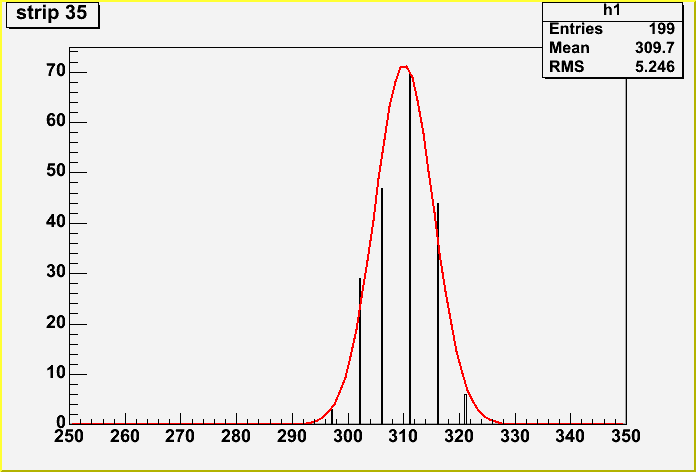
In deed , we know that the pulser amplitude for this run is 100 and it gives ~300 ADC counts
|
For side P.
|
For side N.
|

|

|
I loop on the strips who are fired more than 100 times( my Tuple is made with 200 events so 200 times fired is the max ),and then I have this cut on the adc value
Then I fit for each strip the adc Value and take the mean of the fit for all strips in a A128 and obtain the mean adc P value
I do this for all A128 in a wafer (6) and for the N side and then I calculate the ratio
|
For a wafer.
|
For a wafer.
|

|

|

| A128 | mean adc P | mean adc N | ratio |
| 1 | 310.273 | 338.552 | 1.09114 |
| 2 | 310.746 | 320.809 | 1.03238 |
| 3 | 293.453 | 306.4 | 1.04412 |
| 4 | 313.575 | 310.809 | 0.991179 |
| 5 | 288.894 | 292.263 | 1.01166 |
| 6 | 298.218 | 321.308 | 1.07743 |
I try with 2 another pulser runs (6057018 and 6057032) and I got for the same wafer :
| 6057018 | | | | 6057032 |
| A128 | mean adc P | mean adc N | ratio | A128 | mean adc P | mean adc N | ratio |
| 1 | 312.158 | 314.969 | 1.009 | 1 | 327.104 | 314.138 | 0.960 |
| 2 | 313.224 | 318.780 | 1.018 | 2 | 325.192 | 328.655 | 1.011 |
| 3 | 295.646 | 297.731 | 1.007 | 3 | 297.953 | 306.205 | 1.028 |
| 4 | 315.842 | 306.631 | 0.971 | 4 | 321.102 | 306.652 | 0.955 |
| 5 | 291.380 | 295.471 | 1.014 | 5 | 292.282 | 296.990 | 1.016 |
| 6 | 300.514 | 294.512 | 0.980 | 6 | 288.820 | 286.928 | 0.993 |
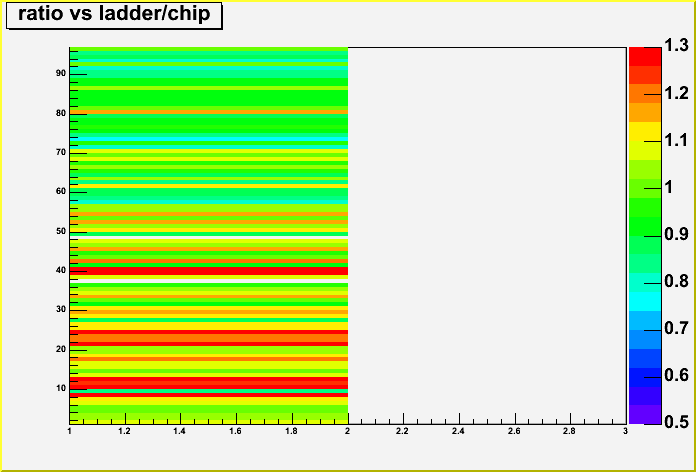
for ladder 1 ( to compare with Jerome's plot )

the text File is :
run 6057008-for ladder 1
Jonathan BOUCHET
Last modified: Thu Nov 25 10:32:52 CET 2004


