
G. Van Buren - BNL
23 Jan 2007
24 Jan 2007 (modified)
We start with the equation:
and define an effective area of the ellipse with radii equivalent to the resolutions:

yielding


and we can even incorporate it into the numerator sum now:

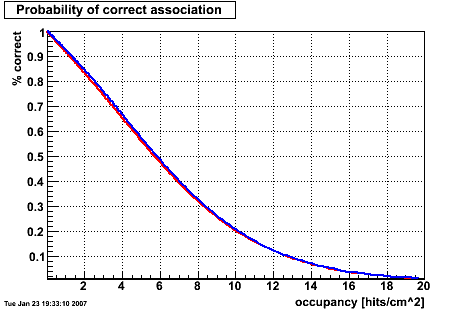
This is a rather small correction. Red is before and blue is after the correction in this plot:

Again, before (red) and after (blue) this correction:


or

To get that result we ask the simple question, "How many hit candidates do I have for association with a track?" The existence of the track implies at least one hit. So we want to know the number of hits in the effective area, and our correct hit will be one out of those hits. If we do not ask this question per track, we find simply that we expect:

and

This equation is in fact well behaved as ρ goes to zero, but I think it isn't what we want...
If instead we ask this question per track, we multiply each possibile scenario of number of hits (n) by the number of tracks that will experience that number (also n), and then correct for this in the denominator:

and

This matches the other study, which has also been verified by Monte Carlo. If we are incorrect here, then I think we must be incorrect in the other study.
This is not a simple topic to fully appreciate. Pressing forward with this I arrive at:

and the before/after corrections (red/blue) plot is as follows:


This is essentially the same as the following equation where Aσ has decreased by a factor of the pad length over the strip length and ρ is replaced by (n-1)/Ap:
For a while, I thought this was wrong. I figured that since we know there are n hits in the pad, with n-1 hits not from the track in question, I could calculate the probability of properly matching the track by calculating the probability that none of the other candidates are found within the effective area. I proceeded assuming that the probability for any one hit to be in the effective area is p=Aσ/Ap, and the probability that it is not is q=(1-(Aσ/Ap)). The equations then become:


This notably reduces the correct hit association probability. Why exactly this is not right, I believe, has to do with the fact that even if you get other hits in the effective area, you still have some probability to choose the right one. So we must determine the number of expected hits and find the probability of getting it correct (as we have done before) via 1/Nhits.
My first attempt at calculating that for the binomial probability distribution with n candidates (binomial 'events' or 'samples') where N (the number of binomial successes) is greater than zero gives, interestingly, the same result as for the Poisson distribution! (note that the N in brackets is not the same as the n on the right hand side of the equation, sorry for any confusion; n is an upper bound on N)

If this is correct, it means that it is unimportant whether a binomial or Poissonian probability distribution is used for this calculation. As some affirmation, Howard's Monte Carlo simulation seems to agree with this calculation.
However, it is not clear to me why we should use this formula for Nhits in this instance. I used this before because I wanted to calculate this quantity per track, which meant putting an extra n in both the numerator and denominator. However, this particular probability sum for Pc takes that factor into account outside of this particular Nhits calculation. So I think it is wrong to do it twice.
If I instead assume that Nhits = 1 + B, where the 1 is from the track of interest, and B is from the background n-1 hits, then I come to yet another happy coincidence when I take B to be the expected number of hits from a binomial distribution with (n-1) samples because this works out to be the same value for Nhits:

Whatever the reason, this formula seems correct!
I am still trying to understand why this is not so. The pads+strips do improve performance slightly. It has been suggested that this is a subtlety of edge effects, but I have not included such effects in my calculations, and yet the performance has improved!