Wa
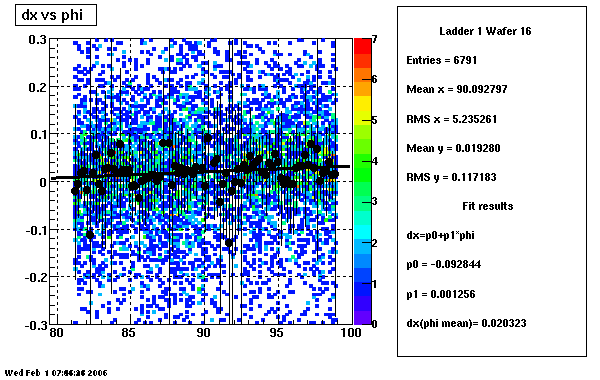
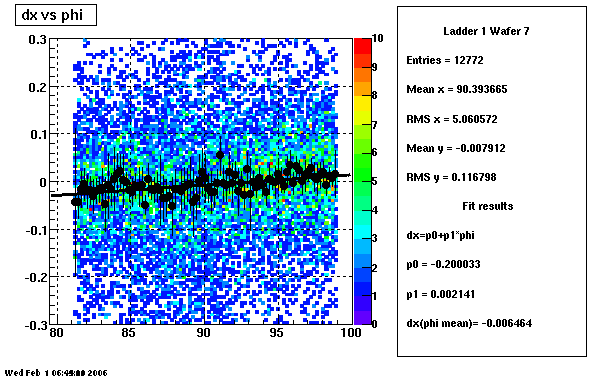
Pass 006
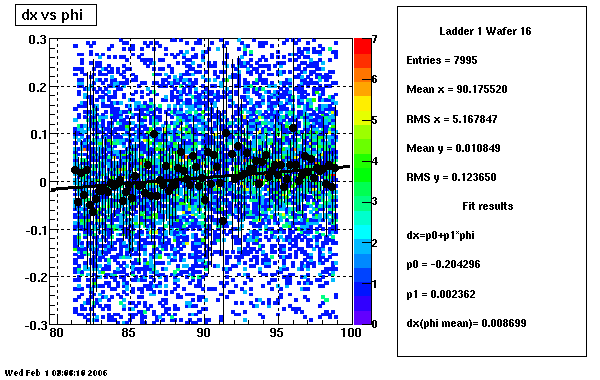
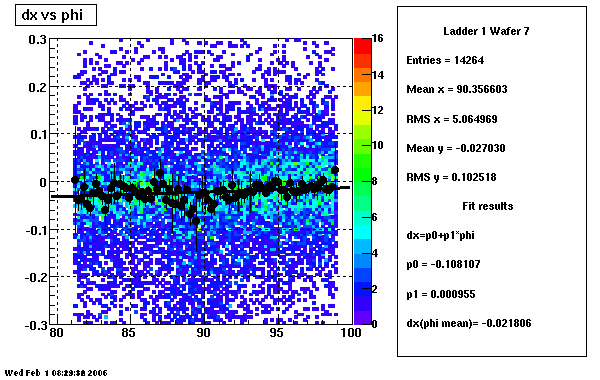
Pass 008
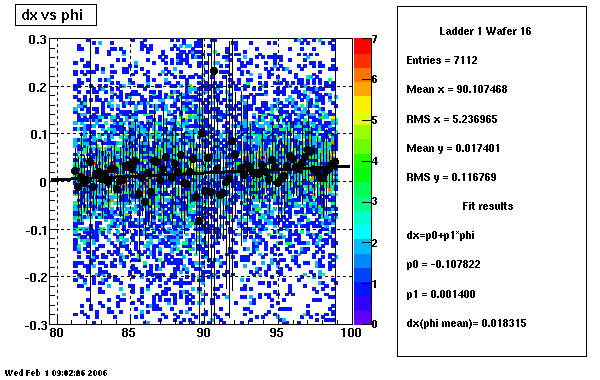
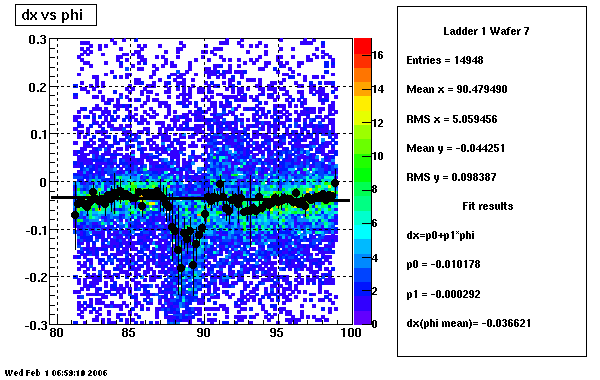
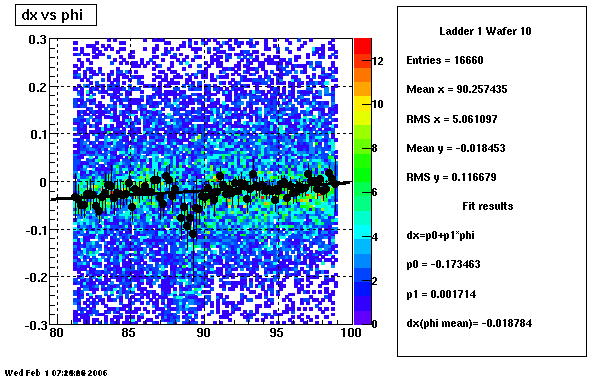
Pass 018
fer
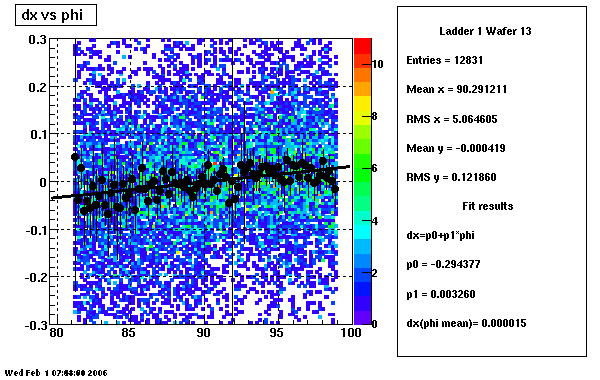
Old data, SVT+TPC
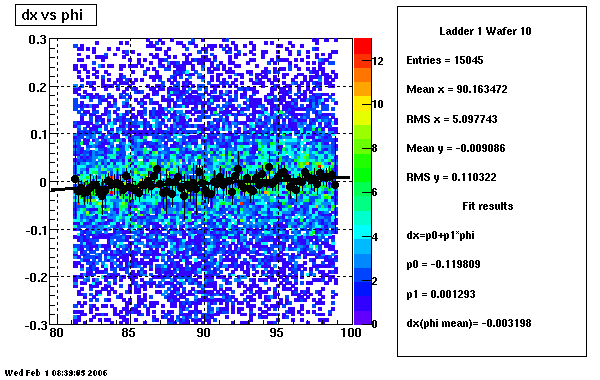
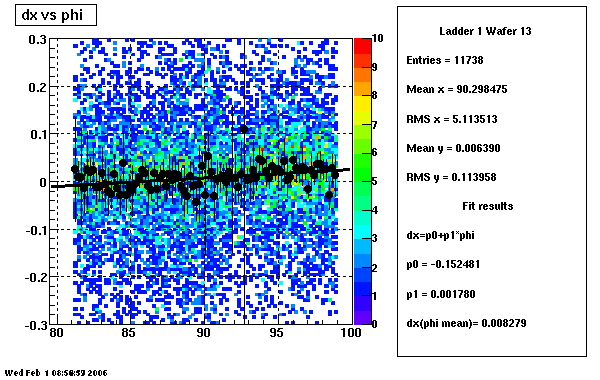
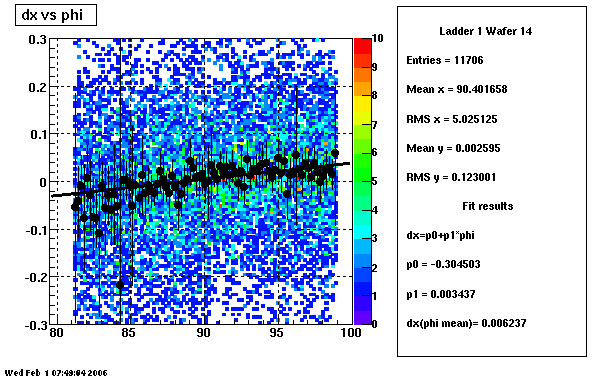
New data, SVT+TPC
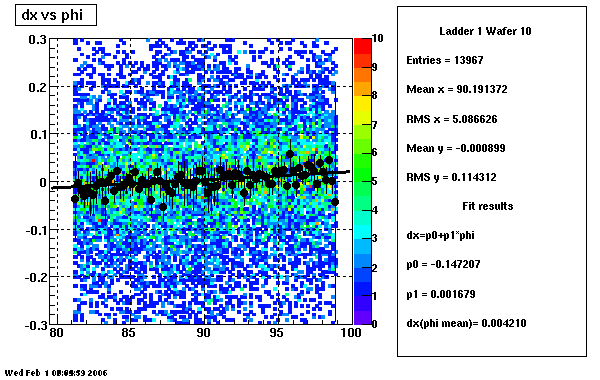
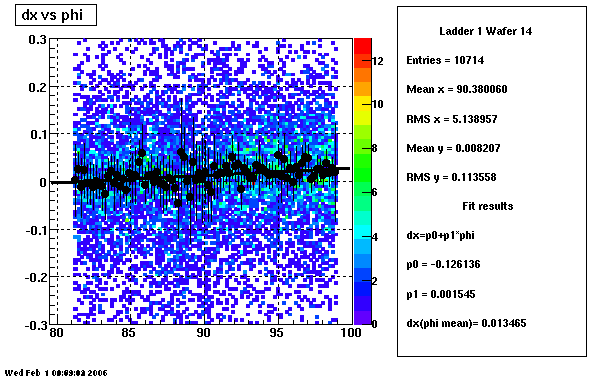
New data TPC alone
All
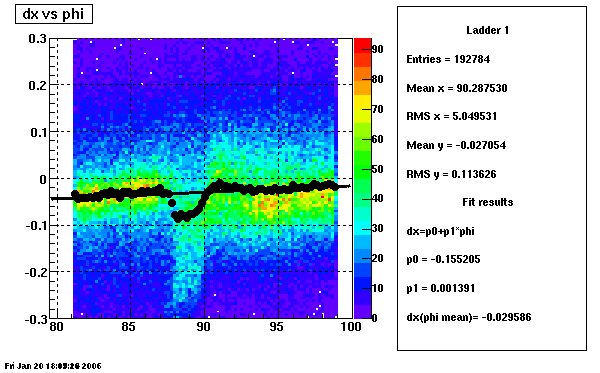
1
2
3
4
5

6
7
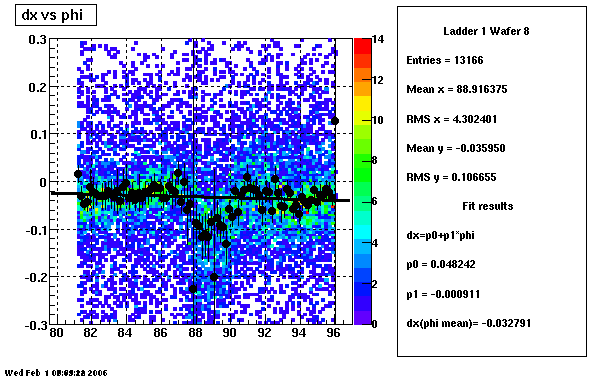
8
9

10
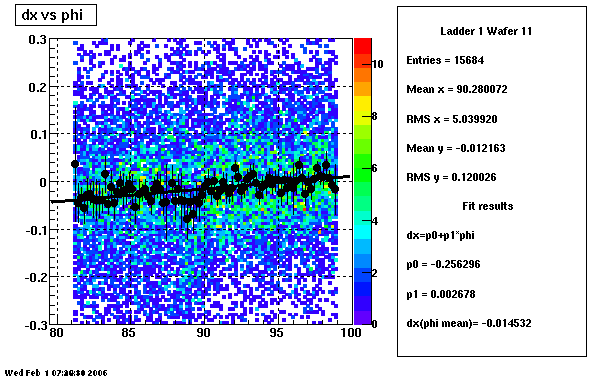
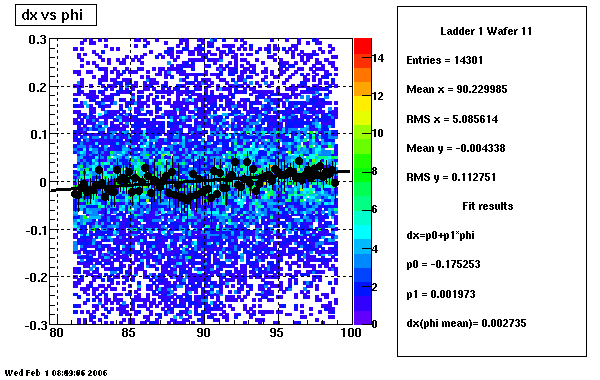
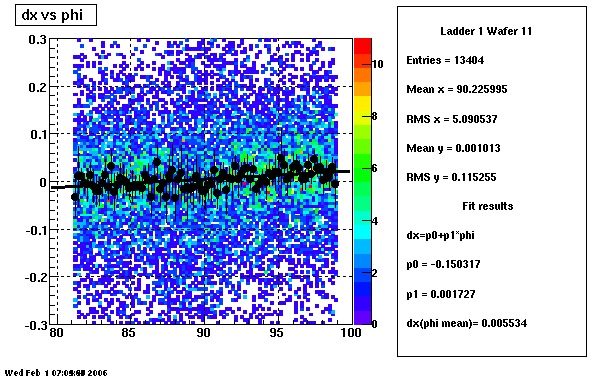
11
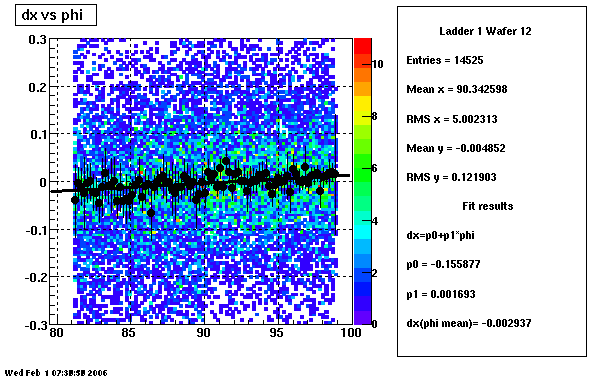
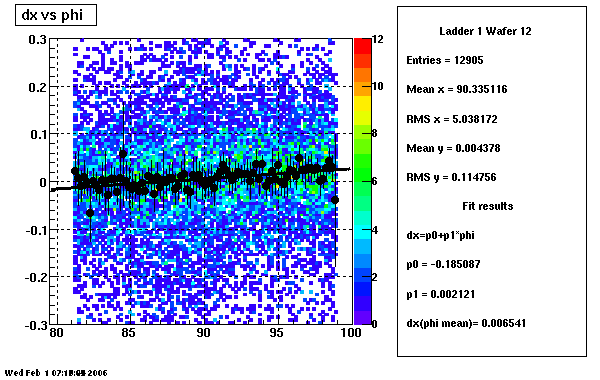
12

13

14
15
16