SVT - Dec. 1999 to Mar. 2000 Cosmic Ray Test Run

SVT - Dec. 1999 to Mar. 2000 Cosmic Ray Test Run
December 99 SVT configuration
Year 1 ladder:
HV and drift:
Laser injection:
Data Location
Complete data table of the cosmic99 test run
The data files are available at:
/star/rcf/daq/1999/12 (at bnl)
In the Dec. 1999 cosmic test run, the SVT had a single 7 wafer detector
ladder placed at the 12 o'clock position inside the STAR magnet.
In this test run, only the west half of the detector ladder was readout.
In the data stream the wafers that were read out correspond to: barrel-03
, ladder-01, Detectors 04, 05, 06, and 07.
The detectors were powered with -1500V, thus a drift field of 500 V/cm.
With no magnetic field, the drift velocity is approximately 6.75 microns/ns.
With full field, 0.5 Tesla, the main effect observed is the transverse magneto
resistance effect, due to the fact that the field is parallel to the plane
of the detector but perpendicular to the drift direction. A transverse
shift of approximately 2.7 mm is expected for a full drift of 30 mm. The
longitudinal magneto resistance will cause a decrease of the drift velocity
of less than 0.1%, thus negligible.
Two laser beams were directed onto one side of detector 07. One of the
laser spots was placed near the anodes and the other one near the
center of the detector. Laser injection was used in both type of events,
cosmic trigger and calibration trigger. However, in the cosmic events,
the laser is triggered 1.5 microseconds after the event has occurred. Due to
this delay, in the cosmic events, only the laser near the anodes can be
seen.
In the calibration events, the laser is injected in sync with the injector
lines, thus both laser spots should be detectable.

Big Blob:
A peculiarity was observed. A huge
signal (blob) was observed at the edge of detector 06. This blob,
we believe is generated by an injector line bonding pad that was somehow
activated during the test run.

and
/auto/pdsfdv10/star/1999/12
(on
PDSF linux machines - pdsflx01,02,....)
or
/net/pdsfdv10/export/data/star/1999/12
(on
PDSF starsu00)
How to look at data
The data can be processed and visualised through the standard STAR software and chain.
At the moment, the libraries necessary to process the SVT data are not committed to the STAR CVS repository.
In order to visualise the data contained in these files is necessary to use Marcelo's ONLINE private code.
The procedure is simple: cd to ~munhoz/svt/ (in any RCF machine), start a ROOT session typing roo4star
and type the command .x svtmonitor.C
A canvas and a GUI window must pop out. The commands in the GUI window are straight forward and very similar
to the ones available in the ONLINE code installed at the svtmonitor.star.bnl.gov machine,
used during the Cosmic Run.
Keep in mind that this is work in progress, so you might experience some problems.
All software will soon be available on the STAR CVS repository.
Some results
Pedestals and Noise Calculation
The Pedestals are calculated for each SVT pixel (anode, time bin).
There are at least two different sources of fluctuations in the ADC read out.
This study tries to answer two main questions:
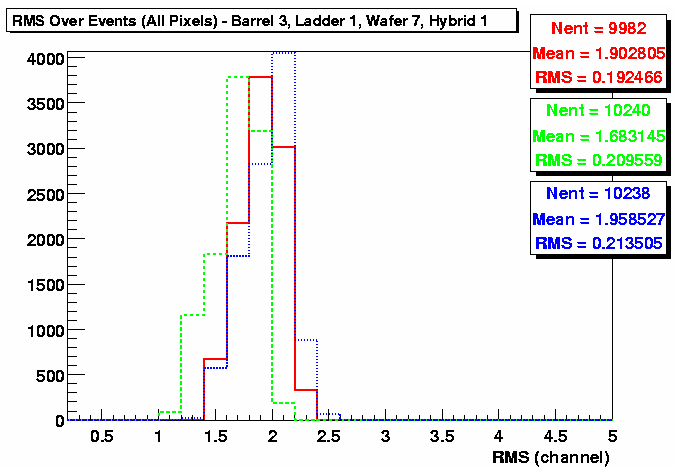
Figure 2 shows the RMS distribution of all pixels from one hybrid calculated over 400 events
(file st_cluster2_0351056_raw_0008.daq). The X-axis is presented in ADC channels,
where each channel corresponds to 4 mV.
The hybrid is divided into 3 analog outputs (AO),
thus each histogram (red, blue and green) corresponds to the pixels from one AO.
Each AO has 127 X 80 = 10160 pixels.
The mean of this distribution is quoted as our noise level.
In this case, NO pedestal subtraction was performed.
This calculation shows a ~7.5 mV noise level for RAW data.
If the pedestals are calculated and subtracted only on a time bin basis, this result won't change,
since the pedestal will represent only a constant offset subtraction (it does not vary in a event by event basis).
Next, the pedestals are calculated and subtracted based on the SCA capacitor instead of the time bin,
in order to eliminate the variations due to the SCA capacitor read out fluctuations. So, in this case,
there is one pedestal value for each (SCA capacitor, anode) pair, instead of (time bin, anode) pair as before.
The pedestal for each (time bin,anode) pixel will vary in a event by event basis,
depending on which capacitor read out that specific time bin in that specific event.
Figure 3 shows the result of such procedure for the same hybrid and the same 400 events as in figure 2.
This procedure results in a noise level, approximately, 1.5% higher than the previous one.
It shows clearly that the ADC read out fluctuations due to time bin variations are greater than
the fluctuations due to SCA capacitor variations.
An additional procedure can still be performed. The pedestals could be labelled or identified as a function of
the pixel (time bin, anode) AND the SCA capacitor.
In other words, instead of having 128(time bins) X 240(anodes) pedestals per hybrid,
one would have 128 X 240 X 128(SCA capacitors) pedestals per hybrid,
and event by event fluctuations due to the SCA capacitors variation could be corrected.
The result of such procedure is illustrated in figure 4 for the same 400 events from the two previous results.
In this case, the pedestal calculation demands a much higher statistics, that was obtained analysing 2,550 events
from files st_cluster2_0351056_raw_0007.daq, st_cluster2_0351056_raw_0006.daq and st_cluster2_0351056_raw_0005.daq.
In this case, the noise level is, approximately, 1.5% lower than the first case.
Therefore, the improvement obtained is very small.
And, given the high statistic demanded by this procedure and the fact that it increases a factor of 128
the number of pedestals to be stored (128*248*128*4 bytes = 15 Mbytes/per hybrid), the cost-benefit ratio
prohibits such procedure to be used during the analysis.
During this analyses, an additional problem was observed.
In order to identify the SCA capacitor number for each time bin in a event by event basis, the capacitor
corresponding to the zeroth time bin is obtained from the header received via the fiber,
stored in the Receiver Board Bank.
An important (and time consuming) step of this study was to check whether this information was correct or not.
In order to do that, a feature presented in the data, that depends exclusively on the SCA capacitors was identified.
Given the time bin of such feature and the zeroth time bin capacitor number, one could verify if the correlation
between time bin and capacitor number was correct.
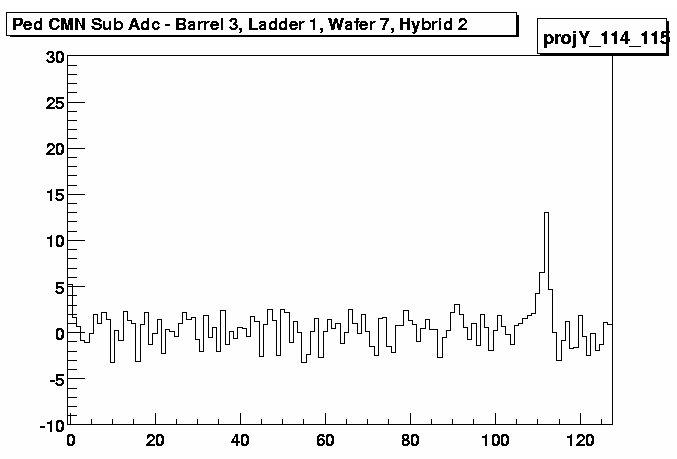
The feature identified was a small step present in all events that corresponds to the end of a cycle of
the SCAs(???). Figure 5 shows such feature as seen in the data.
Using an automatic procedure to identify such feature
(that agrees with a visual inspection, at least for few events checked), it was possible to identify
events where the zeroth SCA capacitor was read correctly.
From a sample of 4250 events, ~82% of the events had a correct zeroth capacitor reading.
Using only these events, the two procedures to calculate the pedestal described above (figure 3 and figure 4)
were repeated, and the result can be observed in figures 6 and 7, respectively.
The results show no improvement in the noise level.
Therefore, this problem does not impact the pedestal calculation or the noise level evaluation.
HOWEVER, it would be nice to have it CORRECTED...
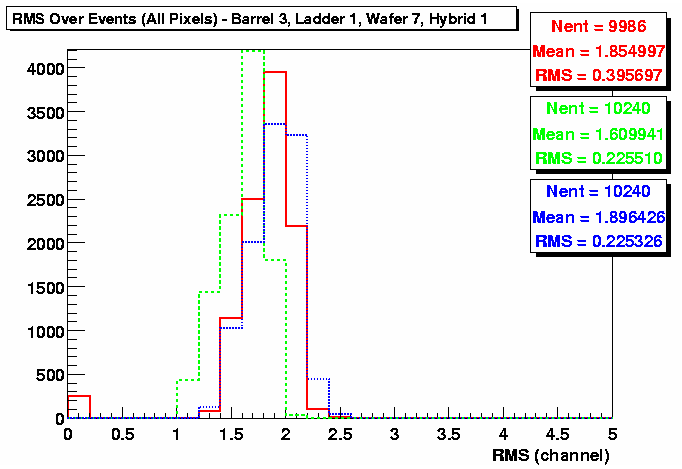
Following Helen's suggestions, I calculated the pedestals taking in account an extra detail.
The first two time bins have always a higher value than the other time bins.
Although they are stable, when one tries to calculate the pedestal relative to the first capacitor,
the "capacitor bin" corresponding to the first time bins will have an anomalous high value,
that makes the pedestals fluctuate sensibly.
Therefore, the procedure here is just to exclude the capacitor bin that correspond to the
first two time bins from the pedestal calculation. Figure 8 shows the RMS obtained from this procedure.
As seen from figure 8, a small improvement (~2.5%) was achieved relative to the time bin pedestal
subtraction (figure 2). This result changes completely the previous conclusion,
where a higher noise level has been obtained with the pedestal subtraction relative to the first
capacitor (figure 3). It shows that the ADC read out fluctuations are higher due to the
SCA capacitors than pixel variations.
The higher ADC values of the first two time bins were introducing extra fluctuation
that "hides" this conclusion.
The first and last SCA capacitors seem to have the same feature as the first two time bins,i.e.,
they present an anomalous ADC value (the "step" of figure 5) that can influence the pedestal calculation.
Therefore, the same exercise as above was performed for the pedestal calculation relative to the first
time bin.
Time bins corresponding to the first and last capacitors were excluded from the pedestal calculation.
Figure 9 shows the result of such procedure.
The noise level obtained is similar to the first procedure (figure 2).
Therefore, no improvement was achieved.
Actually, this result was expected, since the amplitude variation due to the first and last capacitors
is much lower than the variation due to the first time bins.
Still another test can be performed repeating the procedure shown in figure 4,
but this time taking care of excluding the first time bins AND the first and last capacitors
from the pedestal calculation.
Figure 10 shows the result obtained.
An extra ~2% improvement can be achieved with this procedure relative to procedure shown in
figure 8 or a ~4.5% improvement relative to the first procedure (figure 2).
But, again, the high memory demanding of this procedure and the low improvement factor
does not justify its application during the data analysis.
A final study of the noise level corresponds to the common mode noise subtraction off the data.
The common mode noise is given by the mean value of the ADC calculated for each time bin over all anodes.
The common mode noise calculation and subtraction is performed in a event by event basis.
Figure 11 shows the result obtained for one hybrid over 400 events.
This result shows the noise level ~25% lower than all previous procedures (~5.5 mV).
Although it corresponds to a significant improvement, this method cannot be used for a zero suppressed
data taken mode, unless we can make the calculation and subtraction of the c.m.n. fast enough.
However, it shows the source of a significant fraction of the SVT noise.
So far, the questions that motivated this study can be answered as following:
Suggestion and comments are very welcome and important
in order to get a more definte answer to these questions
Looking for hits: matching TPC tracks to the SVT
During two days (03/02 and 03/03/2000), some data was collected using the L3 trigger to
enhance the sample of SVT hits. The trigger selects events where a cosmic ray track projects
near by the SVT ladder.
This data was taken with the magnetic field off, and it corresponds to runs 1062047 and 1063007.
In order to select the tracks that potentially hits the SVT ladder,
the radius where the track reach the z=0 plane was calculated and limited to 20 cm,
using the following expression:
Unfortunately, this expression is not correct (it should be r0 - z0/tanl <= 20 cm),
what compromise any enhancement of SVT hits in this sample.
However, another requirement was used during these runs, that might favor the selection of events with a SVT hit.
It corresponds to the requirement of the track going through certain favorable TPC sectors.
Therefore, the data can still be analyzed and one can try to loop over all TPC tracks in order to
identify the events where at least one track hits the SVT ladder.
This approach was taken, and after looping over the 600 events of these two runs,
only 8 events were identified as having at least one track projecting (close) to the SVT,
and 11 tracks were expected (barely) to hit the ladder.
This projection was performed using two approaches: a helix model
and a straight line projection. Both methods agree perfectly (as they should).
From these 8 events, only ONE hit was found in the SVT ladder. After examining visually
the projection of each track, it seems that they indeed missed the SVT ladder.
The following table shows the point of interception of each of these 11 tracks on the plane x-z, y=10.4
(the position of the ladder).
Since no error was calculated for the track projection and no TPC track reconstruction efficiency was estimated,
it's impossible to reach any definite conclusion about the performance of the detector.
However, this only one event hitting the ladder seems promising... See the figures below.
What's next?
Another approach would be to run the SVT cluster finder in order to look for hits.
The problem with this approach is the large number of injector lines firing randomly,
creating false hits. That's something else to be studied.
For further details contact J. Takahashi or M.G. Munhoz
PLEASE, report all problems you find (to Marcelo).
They correspond to the mean value of the ADC read out for each pixel over several events.
The fluctuation of the ADC read out over these events will result in a RMS value for each pixel.
The distribution of the RMS of all pixels for a given hybrid corresponds to the noise measurement.
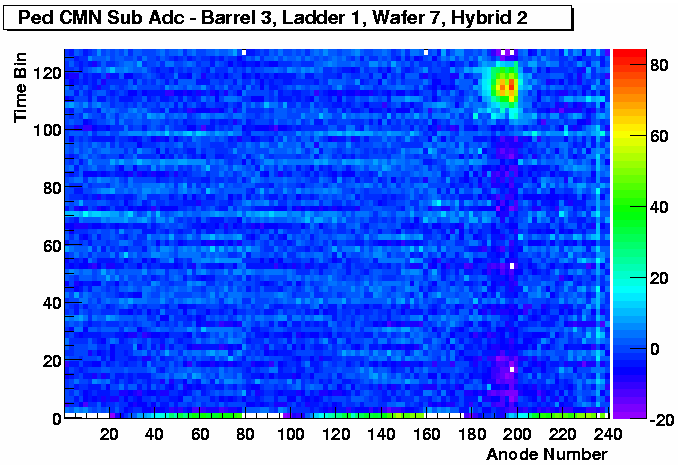
One is due to time bin to time bin variations. This kind of variation can be visualised in figure 1,
where each line corresponds to the ADC value obtained from each time bin as a function of the anode number.
Therefore, the distribution of these lines illustrate the ADC read out fluctuation for different time bins.
The other source of fluctuations is due to variations on the SCA capacitor used to read out a specific time bin
from one event to the other.
Depending on the amplitude of each of these fluctuations, calculating and subtracting the pedestals using the
the SCA capacitor information rather than the time bin information might reduce the noise,
since these fluctuations are subtracted from the ADC value in a event by event basis.

(1) What is the SVT noise level (in mV)?
(2) What is the best procedure to subtract the pedestals (i.e., the one that minimises the noise level):
whether to subtract the pedestal with relation to the time bin or whether to subtract the pedestal with
relation to the capacitor (or both)?


(1) The SVT noise level obtained with the cosmic data from Dec. 99 is ~7mV using
the best pedestal subtraction procedure, and ~5.5mV
performing the common mode noise subtraction.
(2)The most appropriate method to calculate and subtract the pedestals in order to achieve the
lowest noise level, correspond to the calculation of the pedestal relative to the first capacitor, but
excluding the first and second time bins from the calculation.
RUN Event#
Track ID x z Comment 1062047 61 15 2.0 -2.5 Few hits. Fitting unreliable. 1062047 67 2 1.6 11.2 Track split. Bad fitting. 1062047 67 5 -0.4 3.7 Track split. Bad fitting. 1062047 67 8 -3.5 3.5 Few hits. Fitting unreliable. 1062047 78 4 -1.2 18.9 Missed the ladder. 1062047 109 6 -2.5 4.9 Missed the ladder. 1062047 212 2 3.8 10.1 Missed the ladder. 1062047 212 3 2.9 11.0 Missed the ladder. 1063007 74 14 -0.7 20.0 Good one! See figures below. 1063007 135 7 -2.9 20.9 Missed the ladder. 1063007 284 29 -3.1 -2.1 Fitting completely unreliable. 


Jens Berger (from L3 group) and I will try to use the L3 track reconstruction chain to do the same exercise.
This way we'll have an rough estimative of the TPC track reconstruction, and we'll be able to have an idea of
what the L3 trigger was doing.