STAR Offline QA Shift Histogram Description - Run 6
Note:
Not all reference plots may be ideal, be sure to carefully read the
descriptions.
This page contains the reference histograms and descriptions for the
Offline QA system for Run 6. These pages should correspond
exactly to the jobs viewed in the Offline QA Browser. However,
STAR is a dynamic experiment and the plots generated for QA will change
several times throughout the run. If this reference page seems
out-of-date, or if you find a job that would make a better reference,
please email the QA hypernews list here.
Other links:
Michael Daugherity for the QA Team.
April 2, 2006.
Page Index for QA Shift Plots
Page 1
Page 2
Page 1

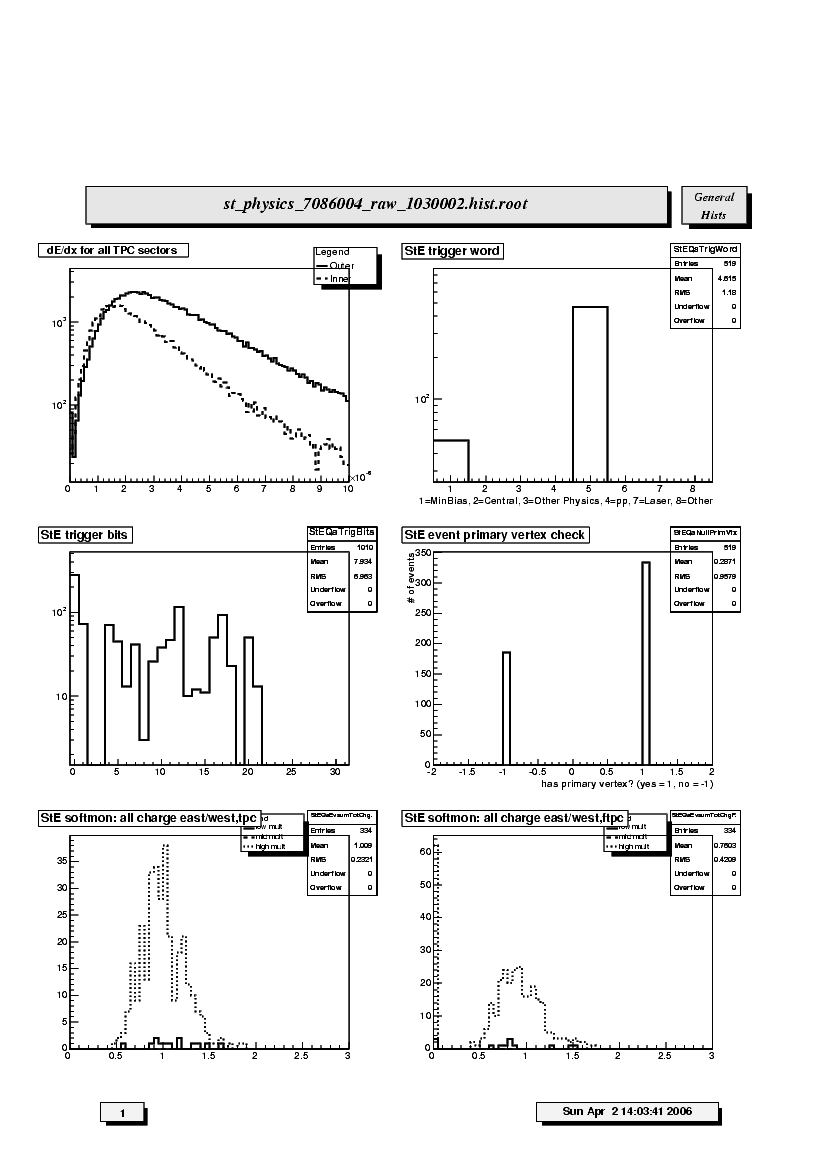
1. dE/dx for all TPC sectors:
Distribution of truncated mean dE/dx for TPC outer (solid line)
and inner (dashed line) sectors. The outer sector values should
be larger than the inner sector due to the difference in
pad lengths. The distributions should have similar Landau
shapes. Peak position is nominally at ~0.015E-04 but could
vary depending on calibrations.
2. StE trigger word:
Distribution of trigger word groups: 1 = minimum bias, 2 = central,
3 = other physics, 4 = pp, 5 = high BEMC tower, 7 = laser, 8 = other.
3. StE trigger bits:
Frequency of usages of 32 trigger bits.
4. StE event primary vertex check:
Primary vertex finding status for run; events with (1) and without (-1)
final vertex. The relative fraction of events with primary vertex
depends on trigger, beam diamond width and position.
5. StE softmon: all charge east/west,tpc:
Ratio of total charge in all reconstructed clusters in TPC east to west
halves for low (solid line), mid (dashed line) and high (dotted line)
multiplicity. Should be peaked at ~1 with FWHM ~ 0.5.
6. StE softmon: all charge east/west,ftpc:
Ratio of total charge in all reconstructed clusters in FTPC East to West
for low (solid line), mid (dashed line) and high (dotted line) multiplicity events.
Should be peaked at ~1.
Page 2

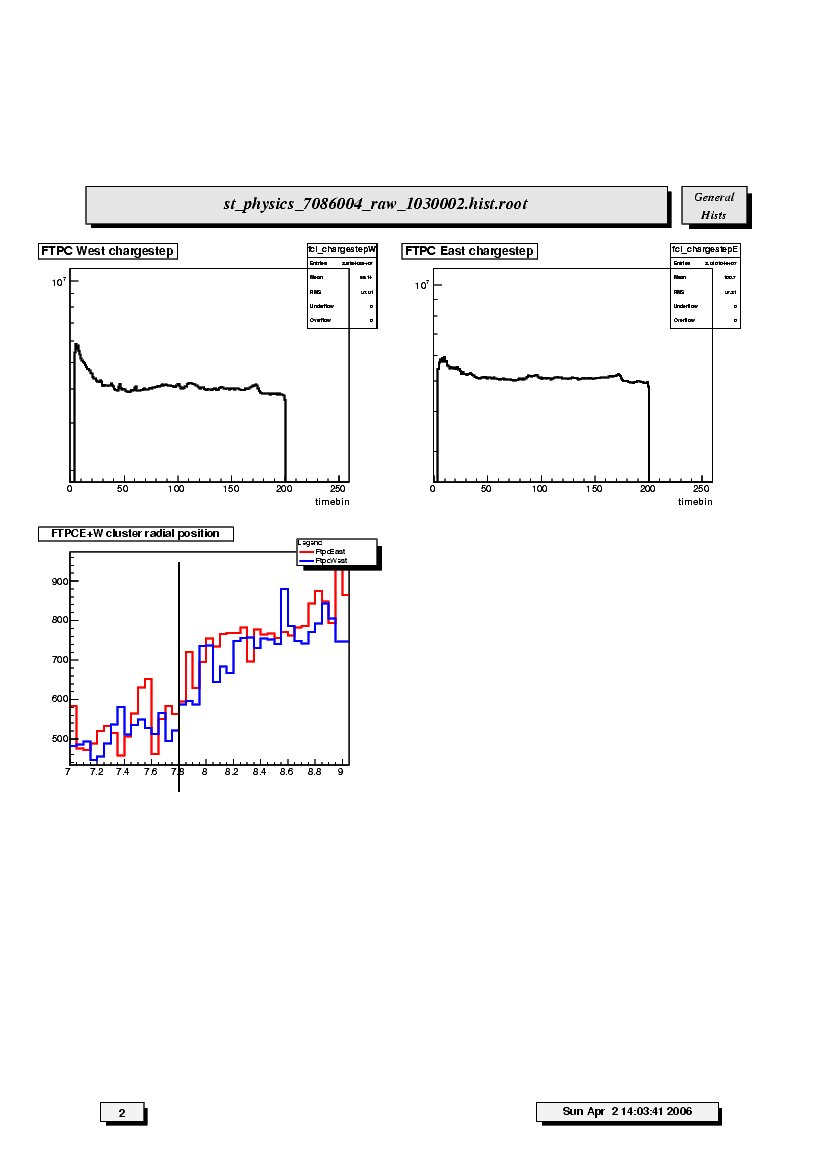
1. FTPC West chargestep:
The real chargestep corresponds to the maximum drift time in FTPC West
(clusters from inner radius electrode) and is located near 170 timebins. This position will change
slightly with atmospheric pressure. The hits beyond the step at timebin 170 are due to electronic
noise and pileup. This step should always be visible even if it is only a "blip".
2. FTPC East chargestep:
The real chargestep corresponds to the maximum drift time in FTPC East
(clusters from inner radius electrode) and is located near 170 timebins. This position will change
slightly with atmospheric pressure. The hits beyond the step at timebin 170 are due to electronic
noise and pileup. This step should always be visible even if it is only a "blip".
3. FTPCW+E cluster radial position:
The cluster radial position histogram for FTPC East(red) and FTPC West(blue) should show the radius
step at the inner radius (~7.8 cm). If the temperature and pressure corrections applied to the FTPC
drift maps are correct, the inflection point of the distribution of cluster radial positions will coincide
with the black vertical line at 7.8 cm. Deviations of more than 1mm (2 bins) should be reported.

