- Chip peds are describe by linear relation :
A+B*stripID . Allow A,B vary event by event. - Pedestal residua (constant per run) were subtracted.
- ADC used below is calculated as:
ADC= - [ rawAdc - chipPed(event) - stripPed(run)]
Details of this procedure are given at here , (see 200 events PDF )
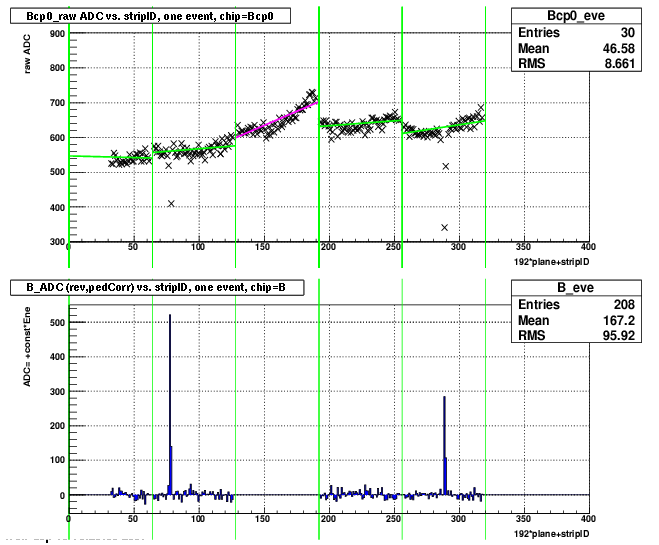
Example of one event: raw ADC (top) , after ped correction (bottom). Plane U (V) spans X-axis 0-191 (192-383).
Vertical green lines mark chip boundaries. Pedestal are marked be the ~horizontal green line. For this event pedestal fit failed QA for the 3rd chip ( magenta) and all ADC's are cleared to zero.
- There are 2 parameters:
seed threshold=100 ADC
total cluster width of 9 strips centered at the seed strip (4+1+4) - Every strips is assigned few independent STAT bits: (serve as mask)
bit 0x1 - broken, ADC set to zero, if ped algo failed for a chip all its strips are marked as broken for this event
bit 0x2 - belong to end of a chip, last 4 strips in a chip, usually ped fluctuates a lot, ADC left as is
bit 0x4 - used by previous cluster, ADC left as is
all other strips have STAT=0 , meaning perfect and not used - find strip max ADC among those with STAT=0 ( strip with STAT.ne.0 can't be a seed)
- if seed ADC exceeds the seed threshold cluster is formed around it, its strips are tagged as used. Use all 9 strips regardless of the STAT bits
- repeat search for max strip until none exceeds seed threshold
- all input events
- events with non-zero cluster per
- events with exactly one cluster
- all strips in this cluster have STAT=0 (it is 'good' clusters)
- Seed cluster distribution vs. strip index, last chip in V-plane is dead
- Seed cluster amplitude. Peak at 580 in the U-plane comes from pegged raw ADC. V-plane is positioned after U-plane and sees less energy.
- Seed cluster amplitude vs. strip index. Now one can identify which chip saturated most often
- Cluster energy (in ADC units).
- Ratio of seed ADC to Cluster energy. V-plane clusters are wider (seed caries less energy), despite saturation of the U-plane.
- Ratio of ADC of 2nd highest strip/seed strip. The peak at ~1.0 in U-plane is probably due to both strips saturate.
- Averaged cluster shape. Events aligned based on position of max strip. Re-normalized to one event. Fit("gaus","I").
* Event QA, condition defined as follows
- input eve
- all 5 chips w/ good peds
- any chip w/ good pedestal
- both plane any cluster
- both plane exactly one cluster
- both plane exactly one and good cluster ('good' is defined in item 4.4 )
* LEFT: 2D cluster position (condition 5) - looks like a beam spot to me.
* RIGHT: cluster energy correlation (condition 6). Clusters w/ saturated strips has NOT been removed, most likely cause of nonlinearity in reco energy.