Eta dependence of gains: M-C and source calibration
All 240 tubes

Selected tubes from sub-sectors 6C, 6D, 7C, 7E. Average gainFactor= targetGain/actualGain over 4 tubes is shown in the table below. The M-C shape is correct and errors individual gainFactor's of all tubes are set to 0.1

| eta bin | gainFac | gainFac err | chi2 | ndf | source inital/setE gain | rms |
|---|---|---|---|---|---|---|
| 1 | 1.26 | 0.05 | 6.55022 | 3 | 0.94 | 0.17 |
| 2 | 1.29 | 0.05 | 1.98782 | 3 | 0.99 | 0.24 |
| 3 | 1.09 | 0.05 | 2.25509 | 3 | 1.14 | 0.37 |
| 4 | 1.07 | 0.05 | 3.07364 | 3 | 1.06 | 0.21 |
| 5 | 1.18 | 0.05 | 6.64246 | 3 | 1.4 | 0.31 |
| 6 | 1.3 | 0.05 | 22.8544 | 3 | 1.54 | 0.10 |
| 7 | 1.48 | 0.05 | 1.57847 | 3 | 1.48 | 0.13 |
| 8 | 1.5 | 0.05 | 5.98291 | 3 | 1.43 | 0.11 |
| 9 | 2.05 | 0.05 | 2.20498 | 3 | 1.58 | 0.25 |
| 10 | 2.54 | 0.05 | 13.1821 | 3 | 1.98 | 0.41 |
| 11 | 2.69 | 0.05 | 1.39156 | 3 | 2.18 | 0.20 |
| 12 | 2.76 | 0.05 | 15.8219 | 3 | 2.09 | 0.47 |
The ratio of the gains from the voltages used in the orginial a files to the gains from the votlages in files qE is shown below for tower 6TC,6TD,7TC,7TE. The mean values and rms from these plots is reflected in the table above.

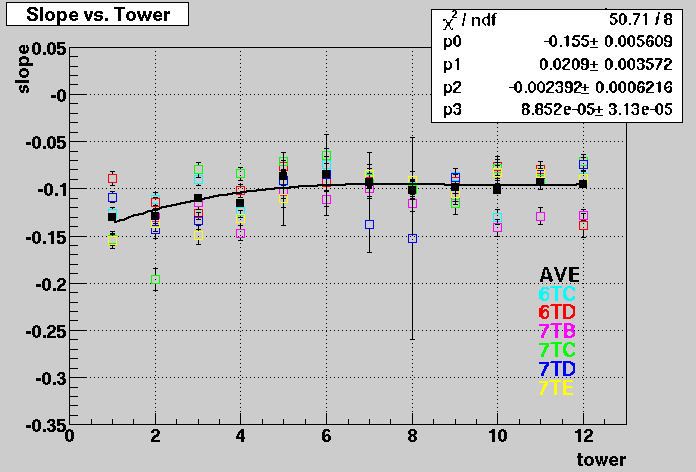
The slope fits from the tower spectra (with isolation cut) in subsectors 7B,7C,7D,6C and 6D are used to provide the template for the final desired eta bin dependance of the calibration. The slopes for these subsectors were statistically averaged within eta bins and fit with a 3rd order polynomial. Towers with bad calibration scans or FEE read out were removed from the average: Towers 1 in 7B and 6D, tower 3 in 7B and tower 8 in 7D.

The table below gives the results of the fit as a fuction of tower number.
| eta bin | fit results |
|---|---|
| 1 | -0.136404 |
| 2 | -0.122060 |
| 3 | -0.111439 |
| 4 | -0.104008 |
| 5 | -0.099238 |
| 6 | -0.096596 |
| 7 | -0.095553 |
| 8 | -0.095576 |
| 9 | -0.096136 |
| 10 | -0.096700 |
| 11 | -0.096739 |
| 12 | -0.095720 |