The following graphs show how the ratio (mean ADC for one fiber to all fibers illuminated) for a given phi bin and eta deviates from the average ratio for that phi bin (ratio/(average ratio) is on the vertical axis and phi bin is on the horizontal axis). The data points that deviate drastically from one signify problem areas. It would be difficult to determine such problem areas in graphs where the data points have a significant spread. Towers with abnormal ratios appear as zeros on the graph. (Abnormal ratios include towers with ratios greater than two and ratios where the mean ADC value with pedestals subtracted is approximately zero - this would mean the tower is detecting pedestals only and is therefore not working properly)
Figure 1: Shows a new ratio of the mean ACD value for one fiber used (Run 1072 - fiber 1 illuminated) to all fibers used (Run 1071 - all fibers illuminated) divided by the average ratio for each phi bin. Ratio/(average ratio for phi bin) is on the vertical axis and phi bin is on the horizontal axis.
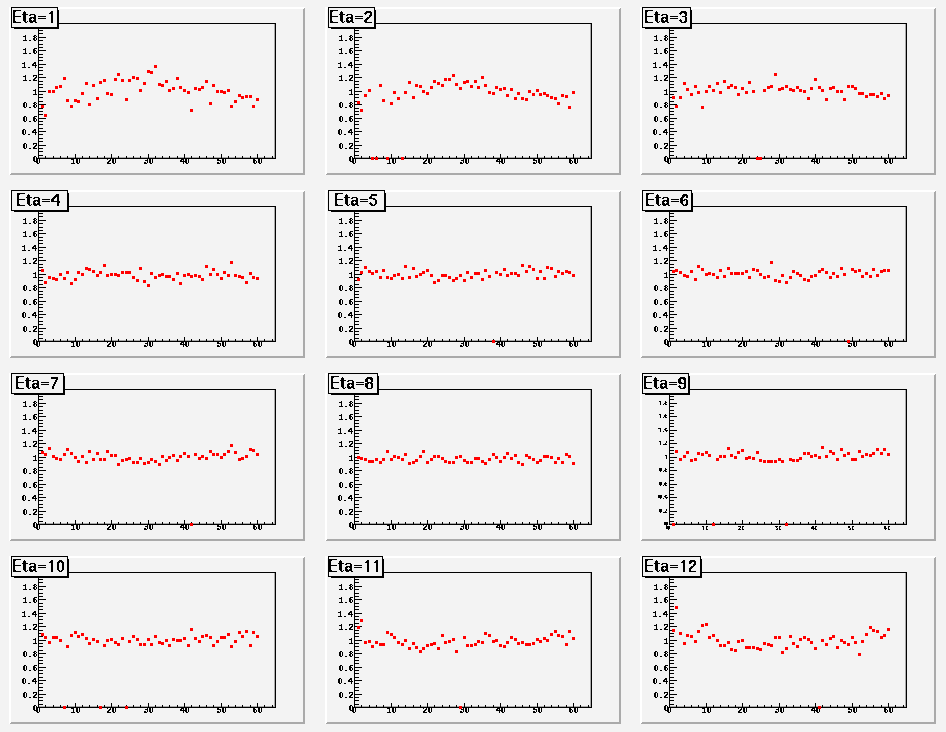
Towers with abnormal ratios that were set to zero for Fig. 1:
r=0 tower 01TA09
r=0 tower 01TE02
r=0 tower 02TA02
r=0 tower 02TB10
r=0 tower 02TD02
r=0 tower 03TB09
r=0 tower 03TC02
r=0 tower 04TB10
r=0 tower 05TD03
r=0 tower 05TD10
r=0 tower 05TE03
r=0 tower 06TD11
r=0 tower 07TB09
r=0 tower 08TC05
r=0 tower 09TA12
r=0 tower 09TB07
r=0 tower 10TD06
Figure 2: Shows a new ratio of the mean ACD value for one fiber used (Run 1073 - fiber 2 illuminated) to all fibers used (Run 1071 - all fibers illuminated) divided by the average ratio for each phi bin. Ratio/(average ratio for phi bin) is on the vertical axis and phi bin is on the horizontal axis.
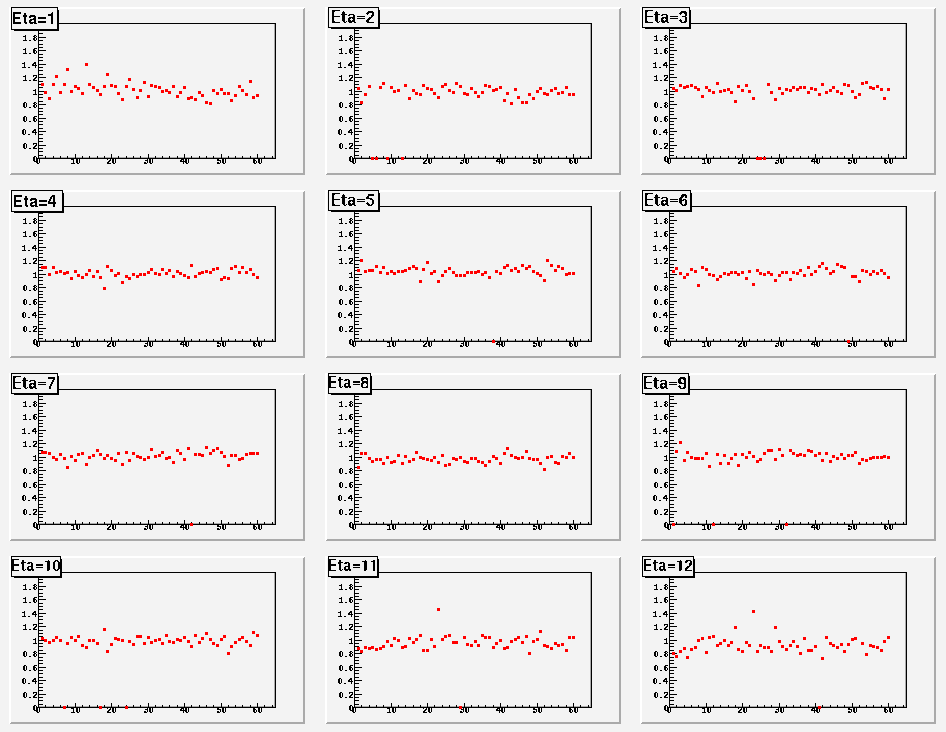
Towers with abnormal ratios that were set to zero for Fig. 2:
r=0 tower 01TA09
r=0 tower 01TE02
r=0 tower 02TA02
r=0 tower 02TB10
r=0 tower 02TD02
r=0 tower 03TB09
r=0 tower 03TC02
r=0 tower 04TB10
r=0 tower 05TD03
r=0 tower 05TD10
r=0 tower 05TE03
r=0 tower 06TA03
r=0 tower 06TD11
r=0 tower 07TB09
r=0 tower 08TC05
r=0 tower 09TA12
r=0 tower 09TB07
r=0 tower 10TD06
Figure 3: Shows a new ratio of the mean ACD value for one fiber used (Run 1074 - fiber 3 illuminated) to all fibers used (Run 1071 - all fibers illuminated) divided by the average ratio for each phi bin. Ratio/(average ratio for phi bin) is on the vertical axis and phi bin is on the horizontal axis.
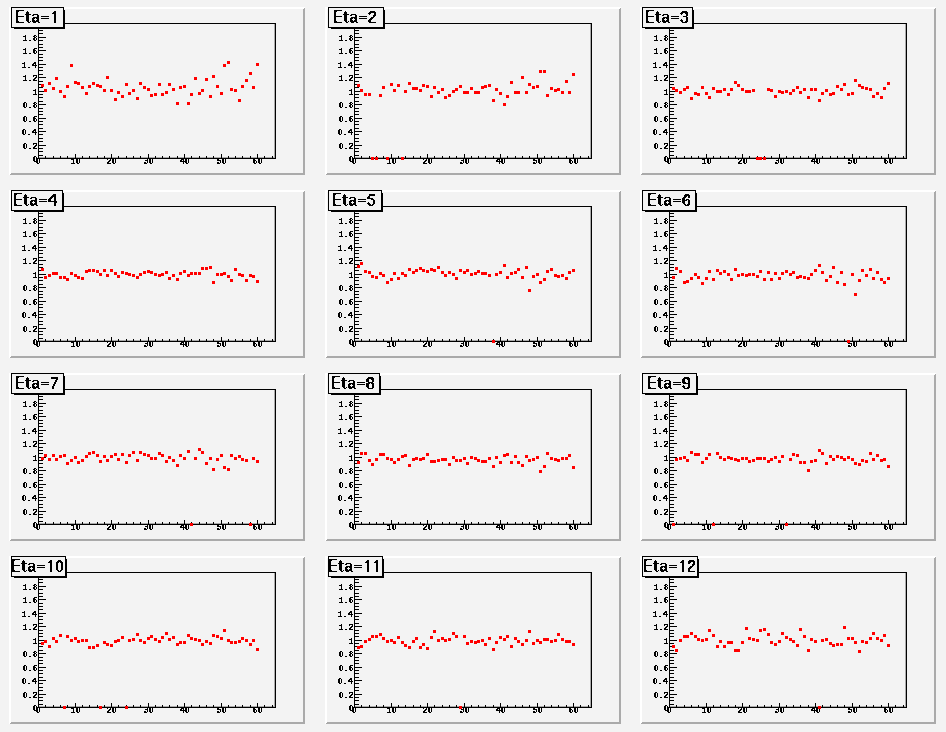
Towers with abnormal ratios that were set to zero for Fig. 3:
r=0 tower 01TA09
r=0 tower 01TE02
r=0 tower 02TA02
r=0 tower 02TB10
r=0 tower 02TD02
r=0 tower 03TB09
r=0 tower 03TC02
r=0 tower 04TB10
r=0 tower 05TD03
r=0 tower 05TD10
r=0 tower 05TE03
r=0 tower 06TA03
r=0 tower 06TD11
r=0 tower 07TB09
r=0 tower 08TC05
r=0 tower 09TA12
r=0 tower 09TB07
r=0 tower 10TD06
r=0 tower 12TC07
Figure 4: Shows a new ratio of the mean ACD value for one fiber used (Run 1075 - fiber 4 illuminated) to all fibers used (Run 1071 - all fibers illuminated) divided by the average ratio for each phi bin. Ratio/(average ratio for phi bin) is on the vertical axis and phi bin is on the horizontal axis.
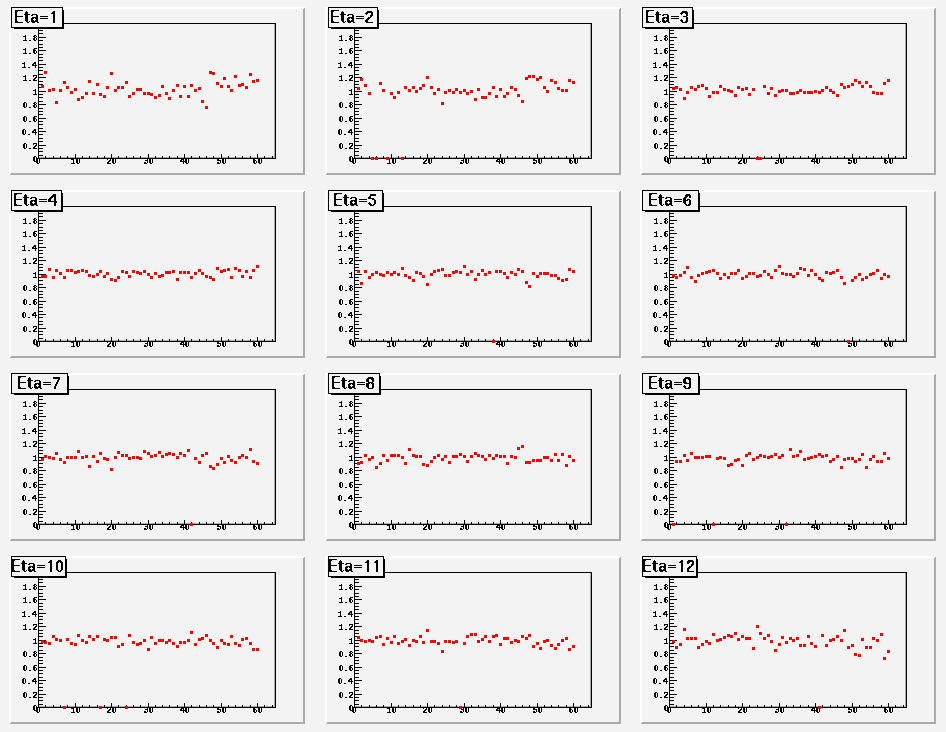
Towers with abnormal ratios that were set to zero for Fig. 4:
r=0 tower 01TA09
r=0 tower 01TE02
r=0 tower 02TA02
r=0 tower 02TB10
r=0 tower 02TD02
r=0 tower 03TB09
r=0 tower 03TC02
r=0 tower 04TB10
r=0 tower 05TD03
r=0 tower 05TD10
r=0 tower 05TE03
r=0 tower 06TD11
r=0 tower 07TB09
r=0 tower 08TC05
r=0 tower 09TA12
r=0 tower 09TB07
r=0 tower 10TD06
Figure 5: Shows a new ratio of the mean ACD value for one fiber used (Run 1076 - fiber 5 illuminated) to all fibers used (Run 1071 - all fibers illuminated) divided by the average ratio for each phi bin. Ratio/(average ratio for phi bin) is on the vertical axis and phi bin is on the horizontal axis.
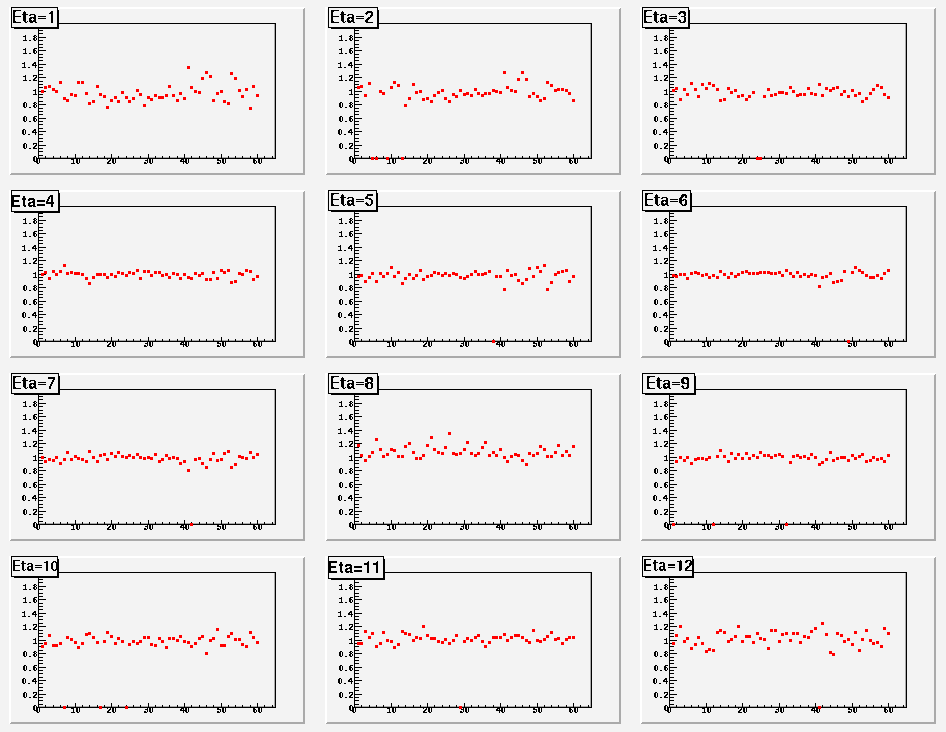
Towers with abnormal ratios that were set to zero for Fig. 5:
r=0 tower 01TA09
r=0 tower 01TE02
r=0 tower 02TA02
r=0 tower 02TB10
r=0 tower 02TD02
r=0 tower 03TB09
r=0 tower 03TC02
r=0 tower 04TB10
r=0 tower 05TD03
r=0 tower 05TD10
r=0 tower 05TE03
r=0 tower 06TD11
r=0 tower 07TB09
r=0 tower 08TC05
r=0 tower 09TA12
r=0 tower 09TB07
r=0 tower 10TD06
Figure 6: Shows a new ratio of the mean ACD value for one fiber used (Run 1078 - fiber 6 illuminated) to all fibers used (Run 1071 - all fibers illuminated) divided by the average ratio for each phi bin. Ratio/(average ratio for phi bin) is on the vertical axis and phi bin is on the horizontal axis.
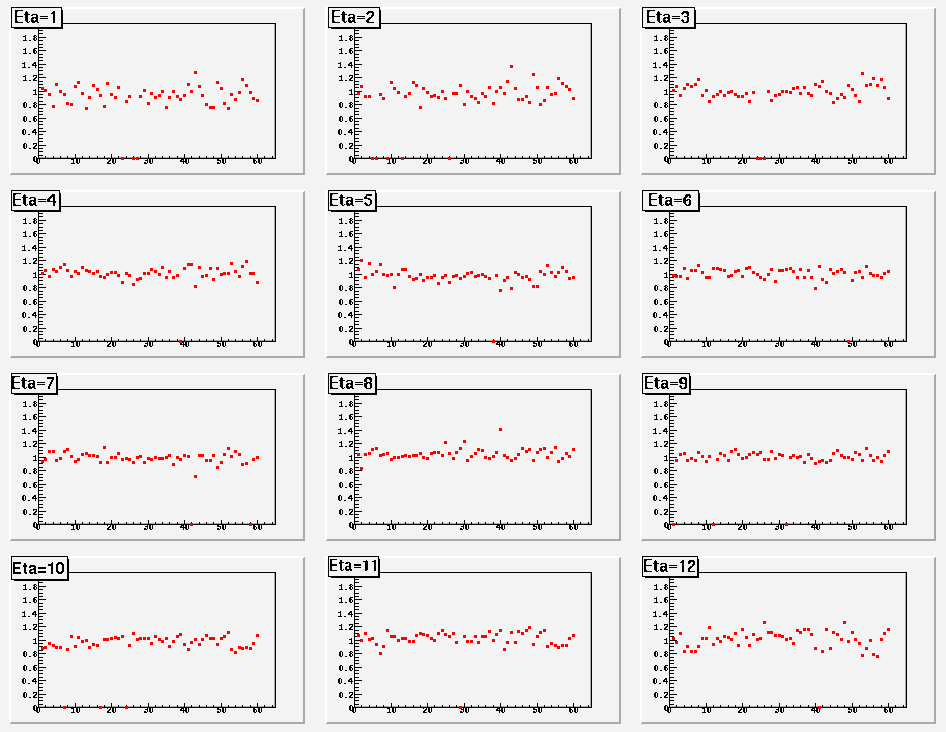
Towers with abnormal ratios that were set to zero for Fig. 6:
r=0 tower 01TA09
r=0 tower 01TE02
r=0 tower 02TA02
r=0 tower 02TB10
r=0 tower 02TD02
r=0 tower 03TB09
r=0 tower 03TC02
r=0 tower 04TB10
r=0 tower 05TC01
r=0 tower 05TD03
r=0 tower 05TD10
r=0 tower 05TE03
r=0 tower 06TA01
r=0 tower 06TA02
r=0 tower 06TA03
r=0 tower 06TB01
r=0 tower 06TD11
r=0 tower 07TB09
r=0 tower 08TC05
r=0 tower 08TD04
r=0 tower 09TA12
r=0 tower 09TB07
r=0 tower 10TD06
r=0 tower 12TC07
Figure 7: Shows a new ratio of the mean ACD value for one fiber used (Run 1079 - fiber 7 illuminated) to all fibers used (Run 1071 - all fibers illuminated) divided by the average ratio for each phi bin. Ratio/(average ratio for phi bin) is on the vertical axis and phi bin is on the horizontal axis.
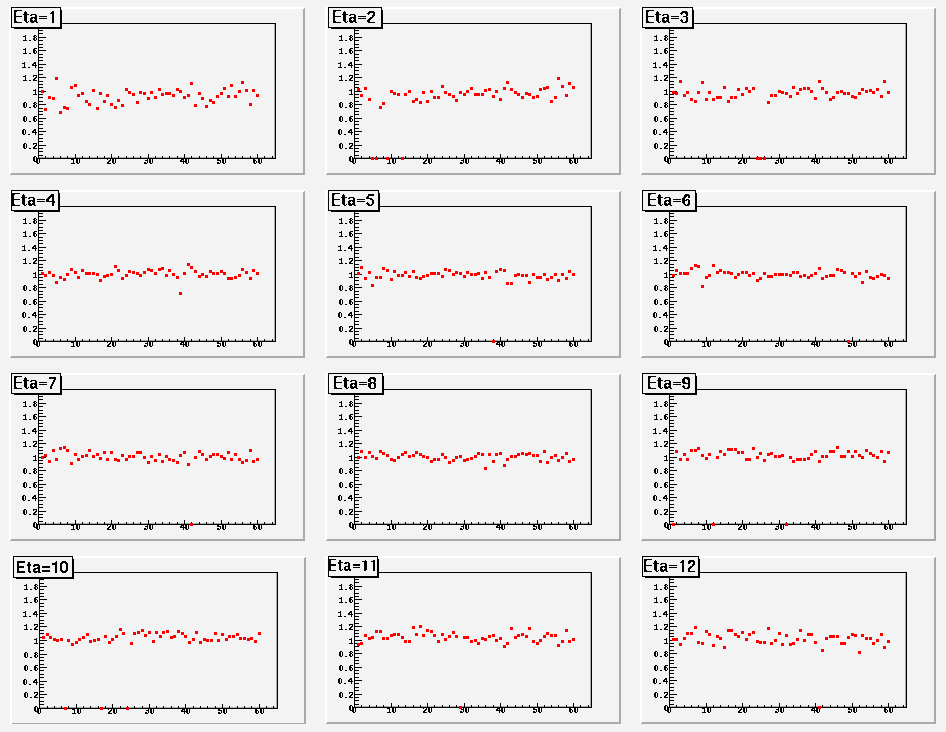
Towers with abnormal ratios that were set to zero for Fig. 7:
r=0 tower 01TA09
r=0 tower 01TE02
r=0 tower 02TA02
r=0 tower 02TB10
r=0 tower 02TD02
r=0 tower 03TB09
r=0 tower 03TC02
r=0 tower 04TB10
r=0 tower 05TD03
r=0 tower 05TD10
r=0 tower 05TE03
r=0 tower 06TA03
r=0 tower 06TD11
r=0 tower 07TB09
r=0 tower 08TC05
r=0 tower 09TA12
r=0 tower 09TB07
r=0 tower 10TD06
Figure 8: Shows a new ratio of the mean ACD value for one fiber used (Run 1080 - fiber 8 illuminated) to all fibers used (Run 1071 - all fibers illuminated) divided by the average ratio for each phi bin. Ratio/(average ratio for phi bin) is on the vertical axis and phi bin is on the horizontal axis.
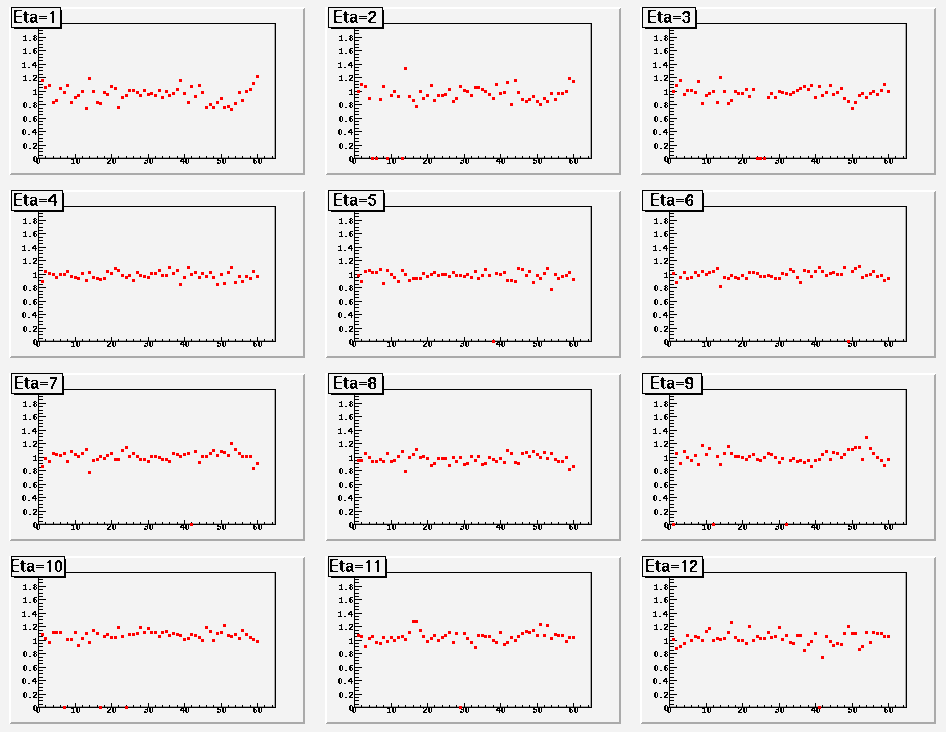
Towers with abnormal ratios that were set to zero for Fig. 8:
r=0 tower 01TA09
r=0 tower 01TE02
r=0 tower 02TA02
r=0 tower 02TB10
r=0 tower 02TD02
r=0 tower 03TB09
r=0 tower 03TC02
r=0 tower 04TB10
r=0 tower 05TD03
r=0 tower 05TD10
r=0 tower 05TE03
r=0 tower 06TA03
r=0 tower 06TD11
r=0 tower 07TB09
r=0 tower 08TC05
r=0 tower 09TA12
r=0 tower 09TB07
r=0 tower 10TD06
Script for producing above plots.


