Single Quartz-fiber Tests: Mean Distribution
For the single quartz-fiber tests, fibers were illuminated one by one and then all at once. Each quartz fiber illuminates three layers of a tower. These tests include runs 1071-1081. The ratio of mean ADC value for a single fiber illuminated to all fibers illuminated was calculated to eliminate gain differences. Pedestals have NOT been subtracted.
Figure 1: Shows the distribution of ratios of the mean ACD value for one fiber used (Run 1072 - fiber 1 illuminated) to all fibers used (Run 1071 - all fibers illuminated) for a given tower and eta. Frequency is on the vertical axis and ratio is on the horizontal axis.
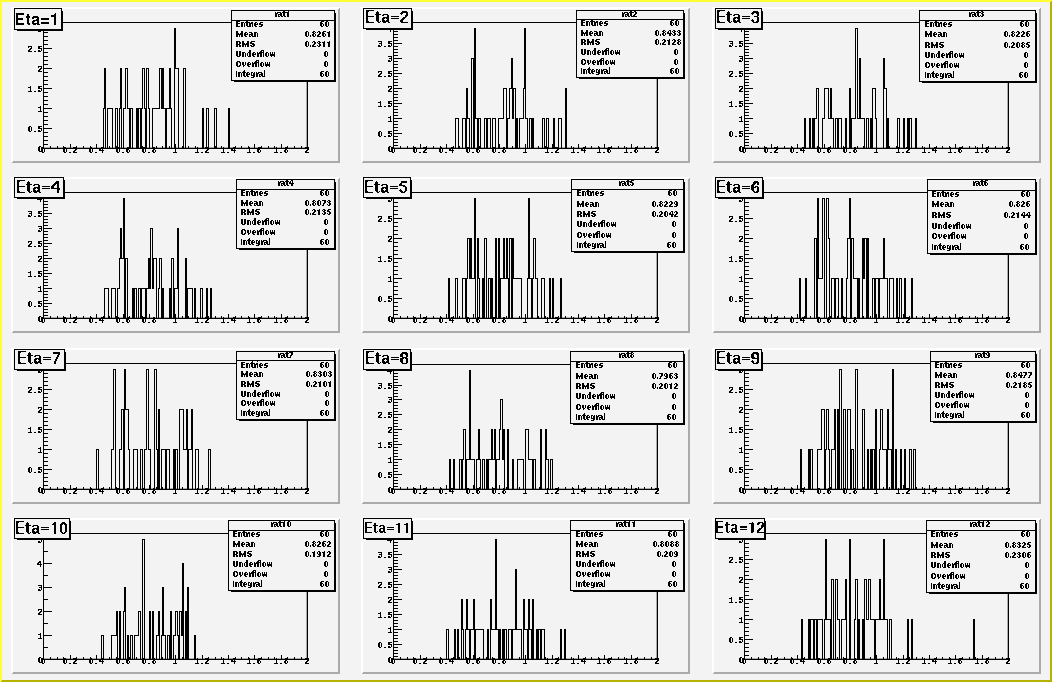
Figure 2: Shows the distribution of ratios of the mean ACD value for one fiber used (Run 1073 - fiber 2 illuminated) to all fibers used (Run 1071 - all fibers illuminated) for a given tower and eta. Frequency is on the vertical axis and ratio is on the horizontal axis.
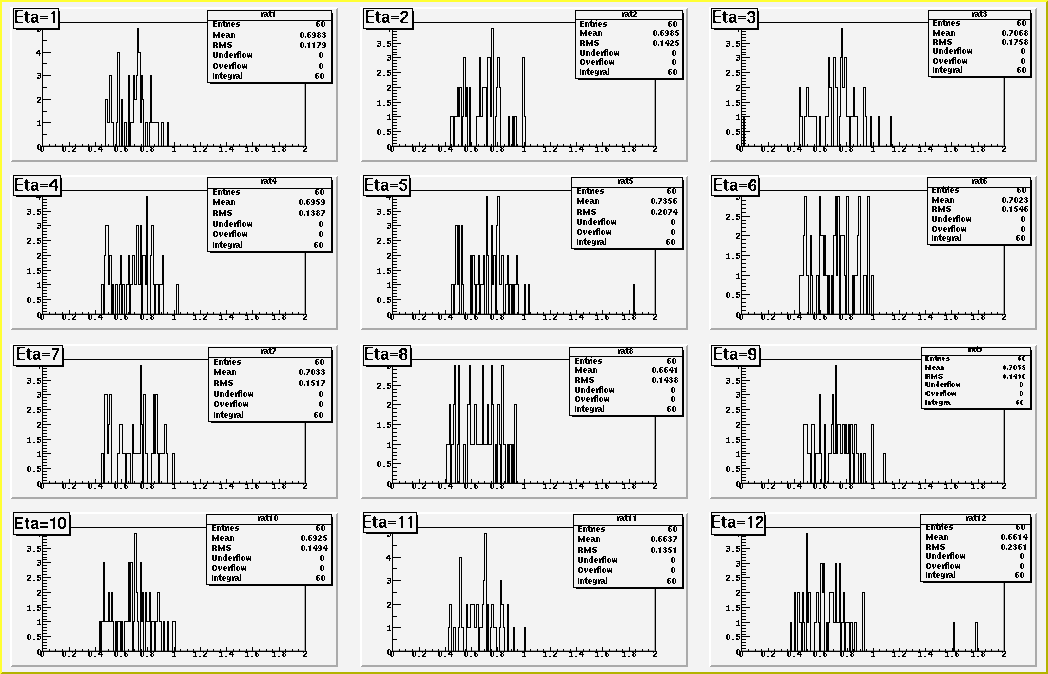
Figure 3: Shows the distribution of ratios of the mean ACD value for one fiber used (Run 1074 - fiber 3 illuminated) to all fibers used (Run 1071 - all fibers illuminated) for a given tower and eta. Sectors 01 and 12 make up the lower peak. Frequency is on the vertical axis and ratio is on the horizontal axis.
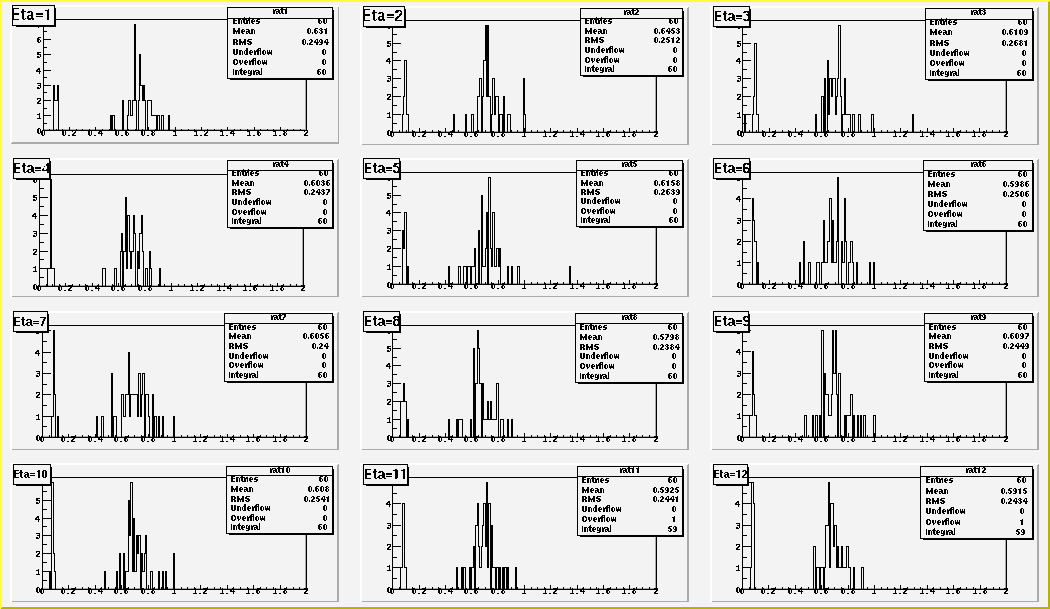
Figure 4: Shows the distribution of ratios of the mean ACD value for one fiber used (Run 1075 - fiber 4 illuminated) to all fibers used (Run 1071 - all fibers illuminated) for a given tower and eta. Frequency is on the vertical axis and ratio is on the horizontal axis.
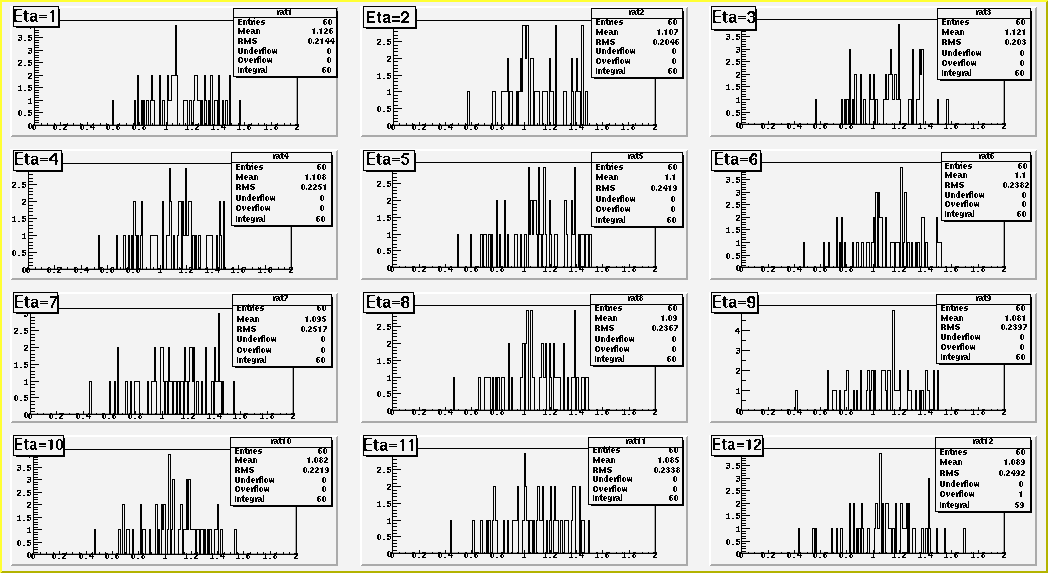
Figure 5: Shows the distribution of ratios of the mean ACD value for one fiber used (Run 1076 - fiber 5 illuminated) to all fibers used (Run 1071 - all fibers illuminated) for a given tower and eta. Frequency is on the vertical axis and ratio is on the horizontal axis.
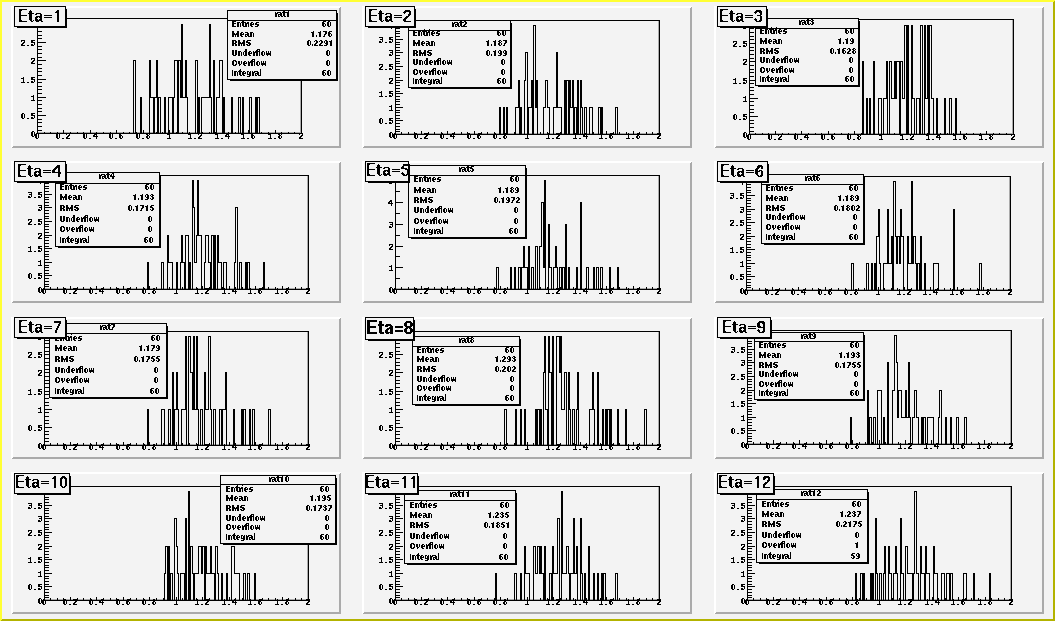
Figure 6: Shows the distribution of ratios of the mean ACD value for one fiber used (Run 1078 - fiber 6 illuminated) to all fibers used (Run 1071 - all fibers illuminated) for a given tower and eta. Frequency is on the vertical axis and ratio is on the horizontal axis.
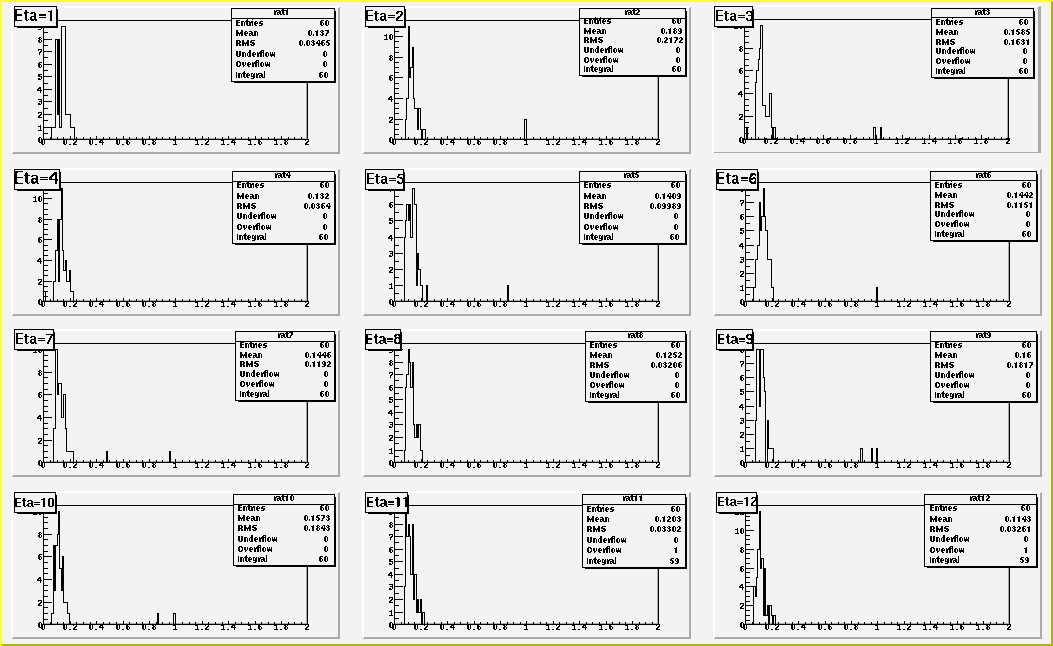
Figure 7: Shows the distribution of ratios of the mean ACD value for one fiber used (Run 1079 - fiber 7 illuminated) to all fibers used (Run 1071 - all fibers illuminated) for a given tower and eta. Frequency is on the vertical axis and ratio is on the horizontal axis.
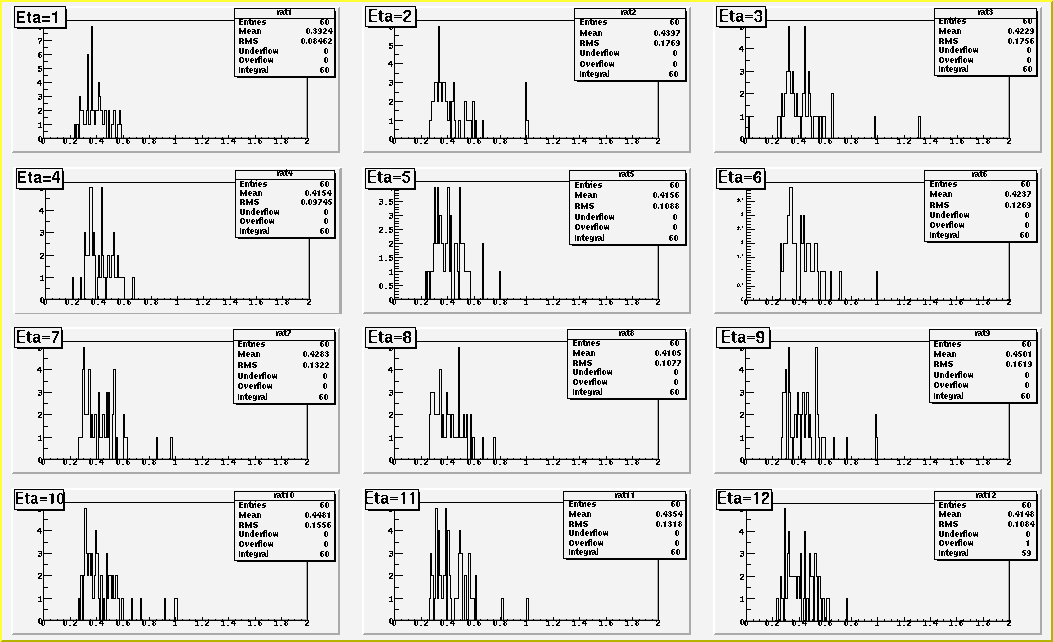
Figure 8: Shows the distribution of ratios of the mean ACD value for one fiber used (Run 1080 - fiber 8 illuminated) to all fibers used (Run 1071 - all fibers illuminated) for a given tower and eta. Frequency is on the vertical axis and ratio is on the horizontal axis.
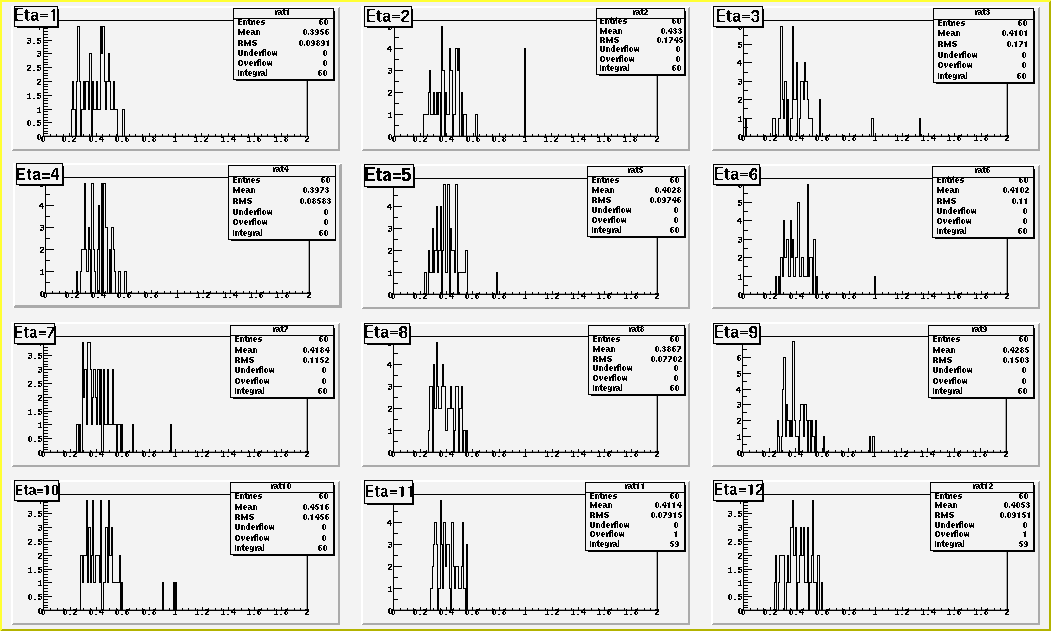
Script for producing above plots.


