The shower-shape used is the sum of two gaussians with a common mean and widths with a fixed ratio. This prodoces a four-parameter fit:
Equation 1
"a" has been fixed to 0.2, which is the average value it achieves when left as a free parameter. This is before cuts, and will be studied once again when a final set of event cuts have been identified.
"b" is fixed to a value of 3.5, which was empirically determined for the fpd. The value seems reasonable for the few-dozen fits I've examined.
The free fit parameters are bounded, such that:
A number of "QA" distributions for raw events may be found here.
Individual hot strips, and strips which are merely "warm", require us to be smarter than root at determining the initial parameterization of the fit. Jan suggested the following procedure, and it works well...
For each set of SMD strips beneath a given tower:


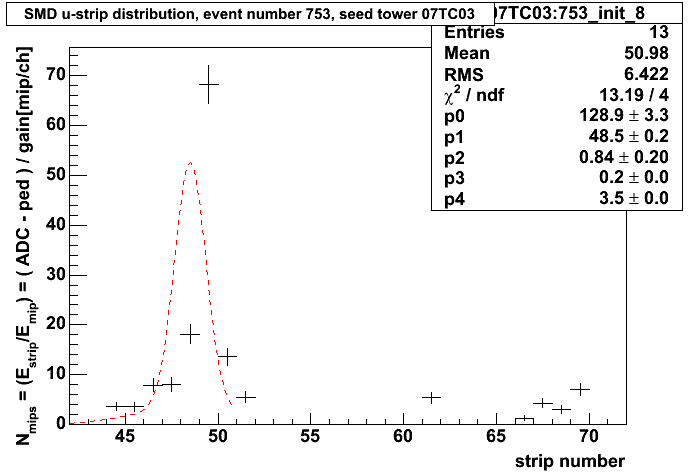
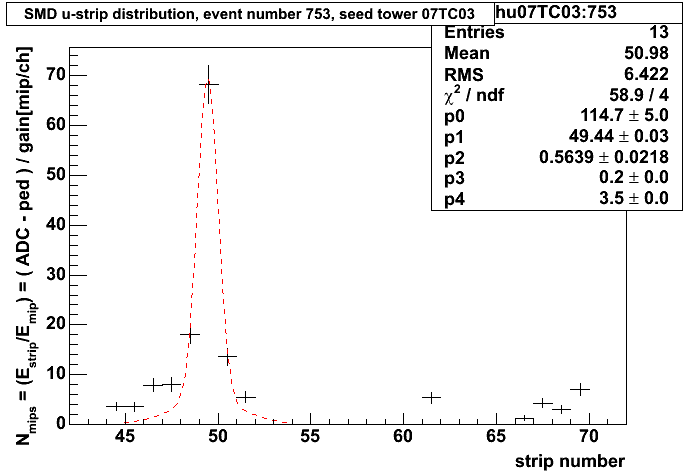
Note: since there has been some local discussion on whether or not the fit should be iterated until it stabilises or not,... the following pathology occurs if I do not iterate:
Figure 0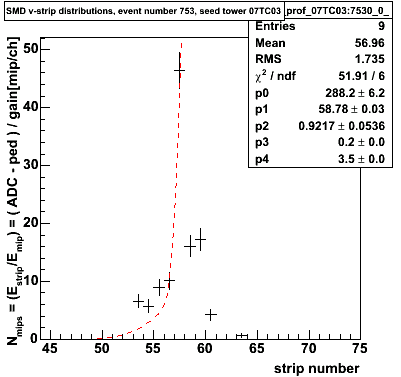
The isolation cut is setup to reject showers where the SMD response beneath the seed tower contains a significant contamination from particles/showers not belonging to the cluster itself. Figure 1 illustrates the problem. If we have a candiate cluster centered on tower A, a second cluster centered on tower B will result in an SMD response in the shared towers which are difficult to interpret.
Figure 1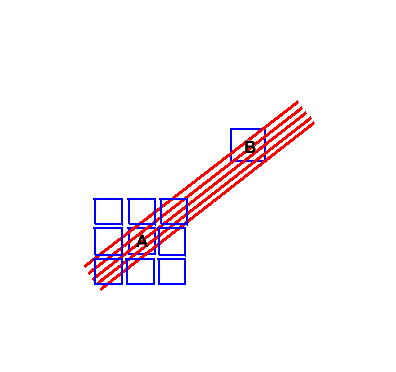
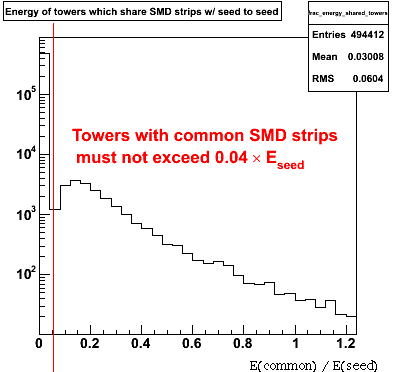
A tight cut has been implemented. Clusters are rejected if any tower outside of the cluster which shares SMD strips (either U or V) with the seed tower has an energy response greater than 4% of the seed tower, Figure 2 shows the energy distribution of towers with SMD strips in common with a seed tower (left), and the ratio of the "other" tower to the seed tower (right).
Figure 2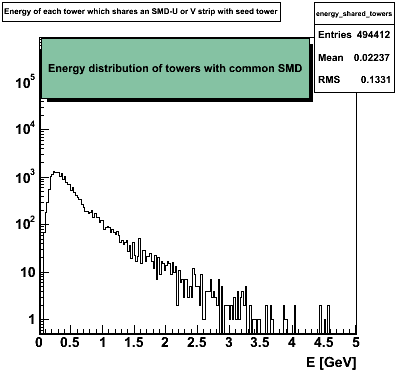
A less restrictive cut can be made by placing limits on the perpendicular-SMD response for towers which share a given set of SMD strips.
Additional "QA" distributions for events which survived isolation cuts can be found here.
Example plots of profiles which failed the isolation cuts are not available at present.
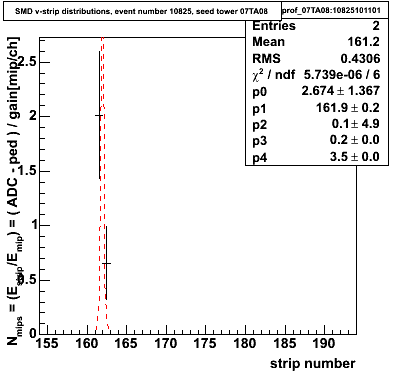
Some simple "profile" cuts were developed to reject MIP-like showers, such as those in figure 3.
Figure 3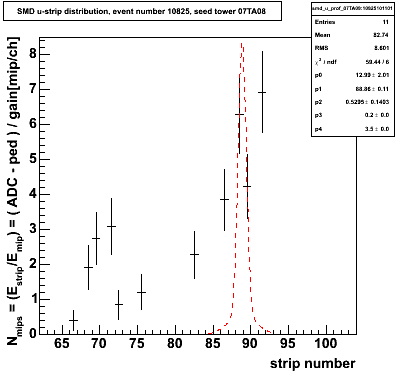
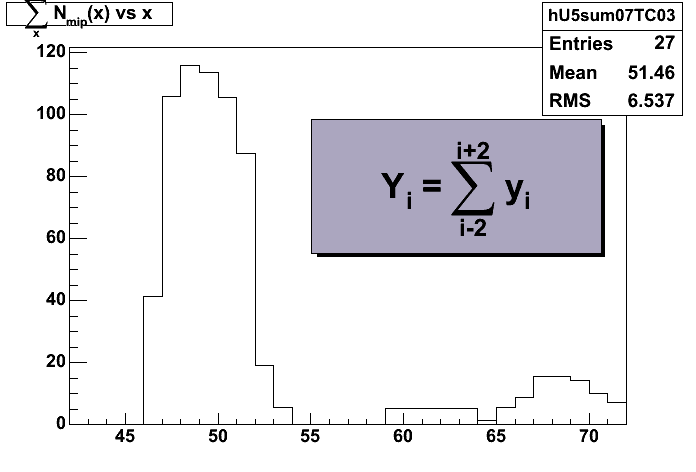
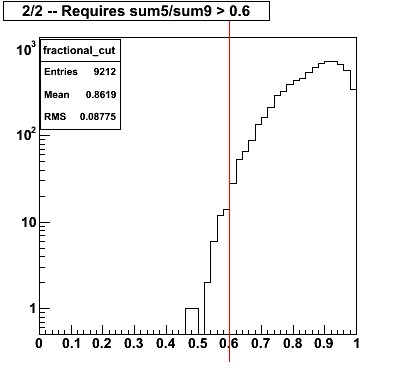
The main cut is a continuity cut. It requires that four of the five strips centered on the initial mean of the SMD profile are nonzero, shown in figure 4. The second cut is on the ratio of the strips summed over the 5 strips centered on the mean to the strips summed over the full range of the fit (9 strips centered on the mean). This is also shown in figure 4. This cut does little, and can probably be discarded. Note-- the different number of entries in the two figures comes about because the second figure is filled after the first cut is applied.
Figure 4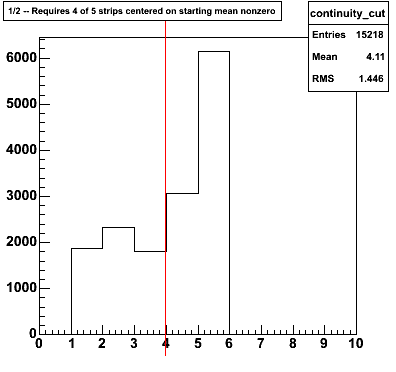
Additional "QA" distributions for events which survived profile cuts can be found here.
Example histograms of SMD response which failed the profile cuts.
Sanity checks need to be applied to the fit SMD profiles. At the moment, chi-squared is not a reliable quantity since
Figure 5 shows the two sanity cuts which are being applied. The first (figure on left) is that the error on the fit mean should be less that 0.2. This is likely to be too tight of a cut, and I will try relaxing it before producing new gains. The second cut requires the fit sigma to be between 0.3 and 3.0 strips.
Figure 5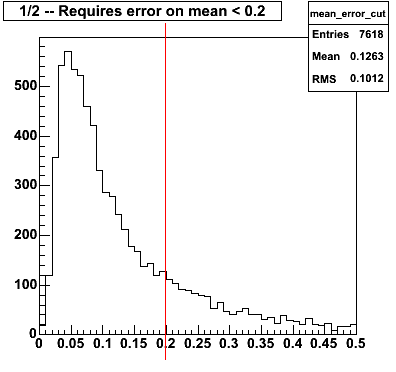
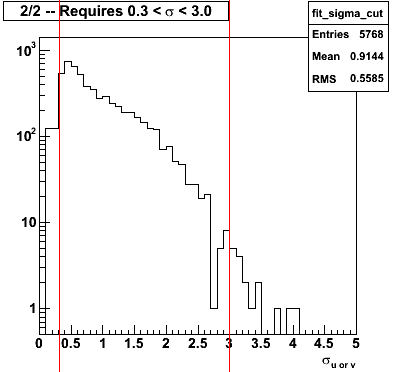
Additional "QA" distributions for events which survived the fit QA (and therefore all) cuts can be found here.
Example histograms of SMD response which failed the fit QA cuts.
Example histograms of SMD response which passed the fit QA cuts.
For each isolated cluster/gamma identified above, we loop over all nonzero strips within +/- 4.5 cm of the fit mean. For each strip, we fill a histogram with the ratio of the measured number of mips passing through the strip divided by the fit function evaluated at the center of the strip.
You can find the spectra of yield-to-fit ratios here for 400 SMD strips.
Figure 6 shows the results of the fits in the above link for each strip in 07U. The fits were performed over the range 0.5 to 2.0, using option "L" (poisson statistics, maximum likelyhood fit). Only spectra which had ≥ 20 events were entered into the following histograms.
Figure 6 -- Relative gain corrections for sector 7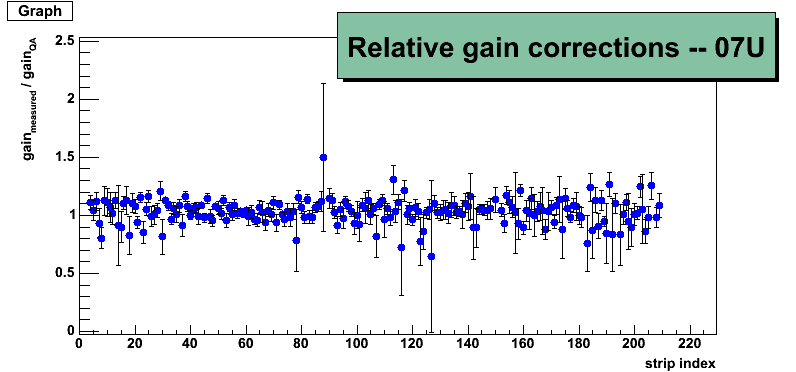
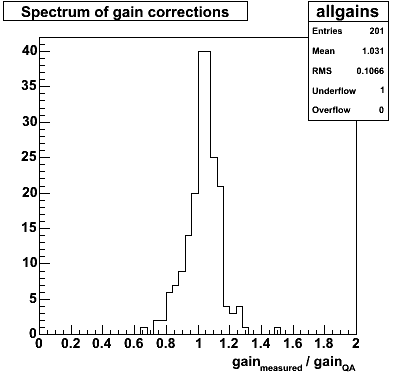
Figure 7 shows the spectrum of these corrections (e.g. figure 6 projected onto the y axis
Figure 7 -- Spectrum of gain corrections for sector 7