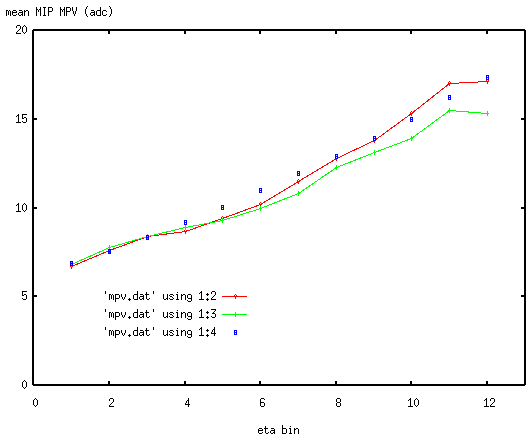
Y-axis: MPV (ADC), X-axis: eta bin

#comparison of mean MPV of MIP (in ADC ch) for 2005 run
# etaBin, CuCu,  pp,    ideal,   Cu/pp
1         6.7    6.8    6.86      0.99
2         7.6    7.8    7.58      0.97
3         8.4    8.4    8.33      1.00
4         8.7    8.9    9.17      0.98
5         9.4    9.3    10.05     1.01
6         10.2   10.0   10.96     1.02
7         11.5   10.8   11.92     1.06
8         12.8   12.3   12.90     1.04
9         13.8   13.1   13.91     1.05
10        15.3   13.9   15.01     1.10
11        17.0   15.5   16.21     1.10
12        17.1   15.3   17.36     1.12
The mean MIP peak position differs for up to 12% for CuCu vs. pp data. The plausible reason of larger reconstructed MIP response for CuCu minB events is higher occupancy than for pp events.
The MIP isolation conditions required for towers:
* 7 inactive strips on either side of fired strip(s) in both planes - this forms a cross 7 cm wide, at 45 deg to the tower grid
* fiducial volume cut requiring UxV sits in 50% area of the tower
For small towers at large eta~2 (eta bin 1) both conditions cover the whole tower area. However for large tiles at eta ~1 (eta bin 12) there
p+p minB events:

p+p minB events
Cu+Cu minB events (view from outside):

I'm working on Endcap calibration very long, to long and start to see things. But I convinced Steve the cross is there. And he even came up with a plausible explanation:
Plot below shows SMD layer 1, the closest to IP. There is a sheet of passive plastic in front of the 1st active SMD layer for sectors 3,6,9,and 12 - it absorbs low energy particles so the UxV condition requiring no signal (in total of 7*2*2=28 consecutive strips on each side of the fired strips) has bigger chance to be fulfilled.

gnuplot>
set key 5,5
set xlabel "eta bin"
plot [0:13][0:20] 'mpv.dat' using 1:2 with  linespoints, 'mpv.dat' using 1:3 with linespoints,'mpv.dat' using 1:4 with point