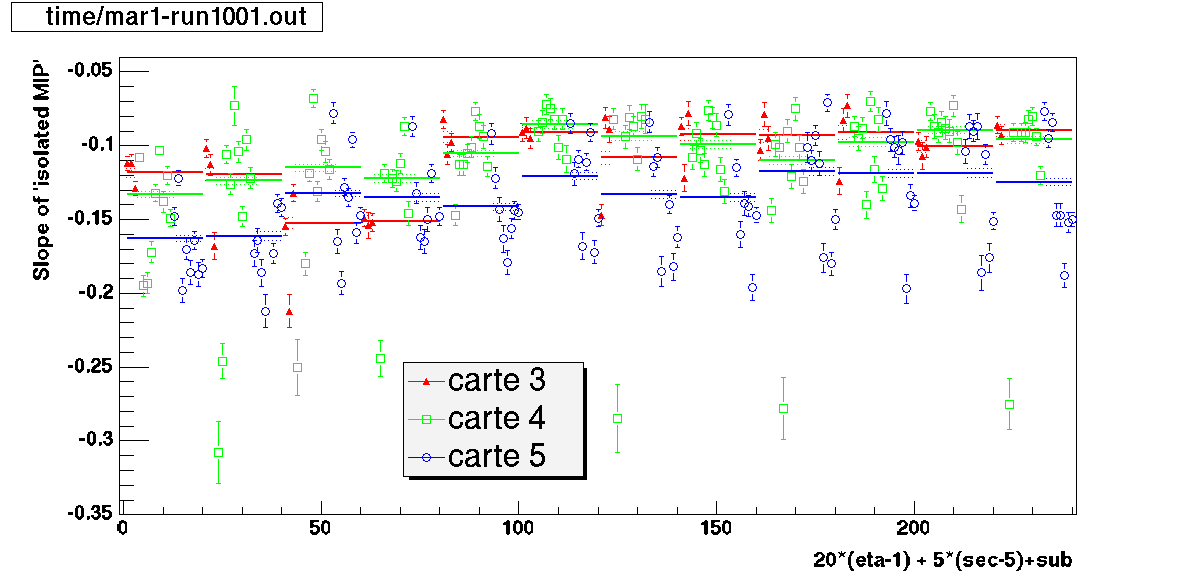
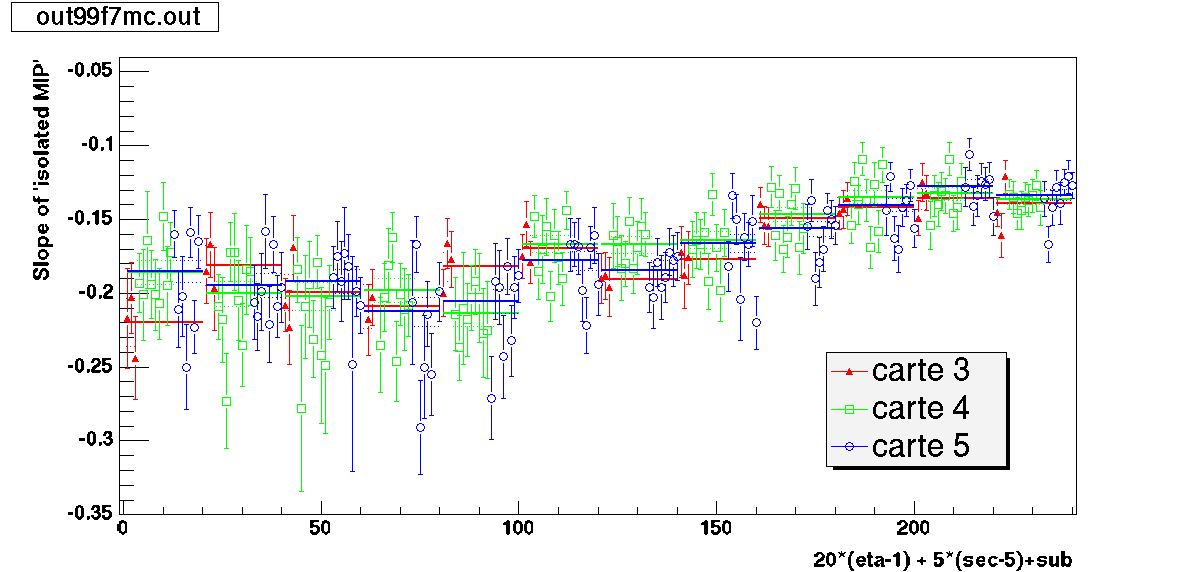
Comparison of the slope of isolated MIPs for real & M-C spectra
Y-axis shows slope of the isolated MIP spectra.
X-axis numbers 240 towers in sectors 5-8.
The physical eta=2.0 is on the left end, eta=1.06 is on the right one.
The phi-bins advance with the step of 1 (1=05TA01 , 2=05TB01, ..., 20=08TE01), subsequent eta bins[1-12] increment X-axis by 20 (21=05TA02, 41=05TA03, ..., 221=05TA12).
Colors denote 3 crates. Horizontal lines were fitted only to the data with the same color (+/- 1 sigma are marked by dashed lines). Solid lines span the whole eta bin.
180K dAu combined trigger events taken on Mar1/run1001, timing: 80/19 80/19 20/19
40K M-C minB dAu events. Towers are gainmatch for E_T max=60 GeV.
plG4.C