Source Scans of 6TC
In an effort to test the source scan methodology, subsector 6TC was loaded with the last set of voltages used for the pp2003 run q6_J
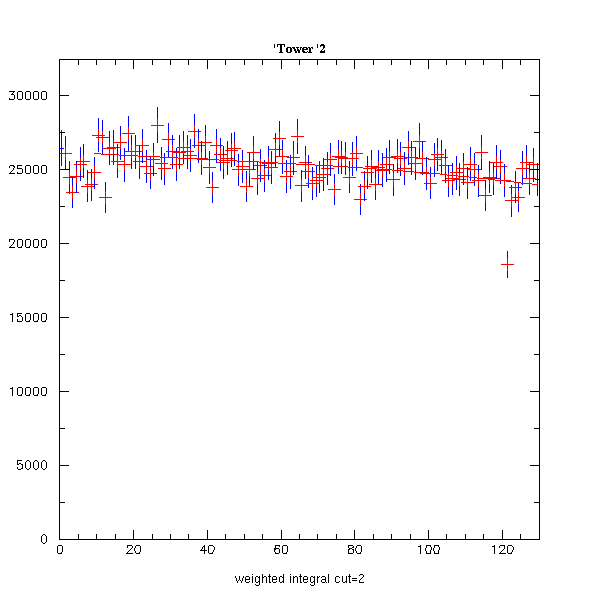
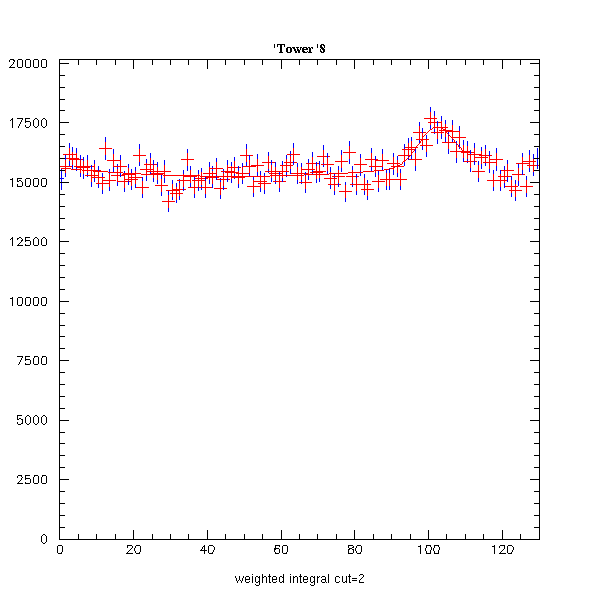
The lower gain of the tubes and the wide pedestal of the WAH resulted in a significant source signal in only 1/3 of the towers. Below you can see plots of towers 2 and 8. Tower 2 has no observable peak to fit - Tower 8 is easily fitted.
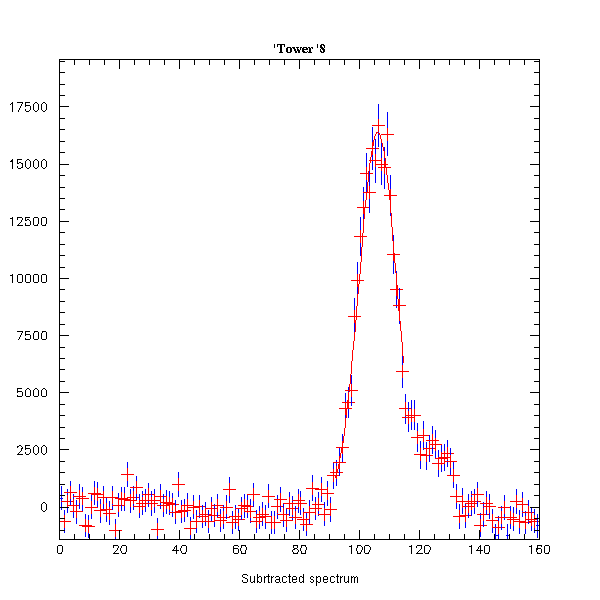
The Final subtracted spectrum for tower 8.
The weighted integral and predicted MIP peak ADC channels from this source scan are here
NOTE: MIP PEAKS may be represented in FERA or FEE ADC!!! FERAch=FEEch * 10 * 108/250
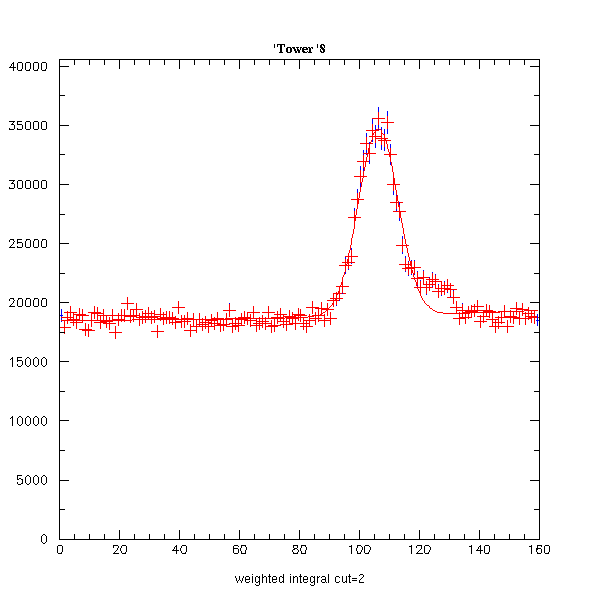
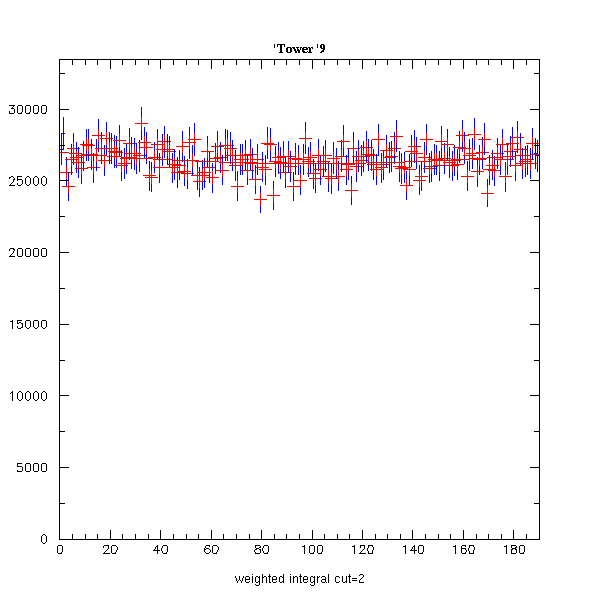
In an effort to get more information about the source scans 200 V was added to each tube and loaded into 6TC. The idea was to increase the gain of the tubes, take the source scan and evaluate the MIP location (MIP200). Then use the LED's to find the gain factor (g) that the tubes were increased by and retrieve the original MIP peaks found with voltages q6_J. MIP=MIP200/g. Here is a sample of the peaks in towers 2,8 and 9. Left is with background and Right is with background subtracted.Tower 9 is a dead tube.
Two scans were run at these voltages to test reproducibility. The scans agree well so they were combined in a weighted average. The gain factor from the optimized LED scans were multiplied by the MIP peak positions in order to calculate the expected MIP position at q6_J voltages. The ave LED gain factor was ~6. Weighted integrals, MIP peaks and LED scans are here
The next step is to compare the Source Scan predicted MIP peak positions to those predicted from the calibrations. Using the ratio of gains/desired gains from the calibration and multiplying it by the ideal MIP ADC positions from the calibrations I calculated the what I refer to as the Calib MIP ADC channels. The table below displays all this information in terms of the FEE adc.
| TOWER | gains/ideal gain | Calib ideal MIP ADC | Calib MIP ADC | Piotr MIP CH |
1 | 2.66 | 6.85 | 18.22 | 0 |
2 | 2.45 | 7.58 | 18.57 | 0 |
3 | 1.93 | 8.35 | 16.12 | 0 |
4 | 1.98 | 9.17 | 18.16 | 15.947 |
5 | 2.06 | 10.02 | 20.64 | 18.304 |
6 | 1.84 | 10.93 | 20.11 | 15.547 |
7 | 1.91 | 11.88 | 22.69 | 20.185 |
8 | 1.66 | 12.87 | 21.36 | 18.244 |
9 | 0.00 | 13.92 | 0.000 | 20.0 |
10 | 1.47 | 15.01 | 22.06 | 20.809 |
11 | 1.25 | 16.15 | 20.19 | 19.122 |
12 | 1.28 | 17.35 | 22.21 | 21.073 |
The comparison between the three source scans, the MIP ADC goal and predicted calibration MIP peaks is below:

The source scan MIP are obviously much too low. Most of this descrepancy can be accounted for ... but first notice the high correlation between the Source scans and the Calibration MIPs. Although they are separated by a systematic factor, they are proportional to each other. Below is a plot of the ratio of the Calibration MIP peaks in the FERA divided by the Average q6_J+200 scans MIP peaks. The source peaks have been corrected by the LEDs and for estimated loss due to a year of source decay ~18%.

The error bar only reflects the source weighted integral errors so they are very conservative. Obviously these two data sets are highly correlated but differ by a factor of ~3. The majority of this difference is due to an error on my part. The number of counts in a bin changed from the roofbeams to the WAH from 20,000 to 10,000. This would make the weighted intregral a factor of 2 smaller than on the roofbeams. These leaves a 30% difference between the two sets. There are several possible causes of a 30% effect in this analysis. One possibility, not yet untested, is the true FERA/FEE conversion, which could be measured at the WAH. NOTE: The number of counts/bin was correct (=20000) when inital WAH source scans in FALL 2002 were completed. The mistake occured ONLY during FALL 2003 data taking and resulted from using code located on eemc-testdaq.starp.bnl.gov instead of eemc-sc.starp.bnl.gov .
Conclusions
Source scan reproduces the calibration results with a 30% systematic offset
Error in events/bin explains why gains were too high this year but doesn't explain lack of eta dependence
Source scan predicts current eta dependence correctly so presumably it is not a flaw in the methodology of the scans
Are Source scans results gain dependent (and if so where is critical gain?)
LED centroid ratios are lower than expected according to (HV1/HV2)^n = (gain1/gain2) where n = dynode -2
LED's show signs of power law behavior but should be tested.
What is true FERA/FEE conversion for this measurement?
