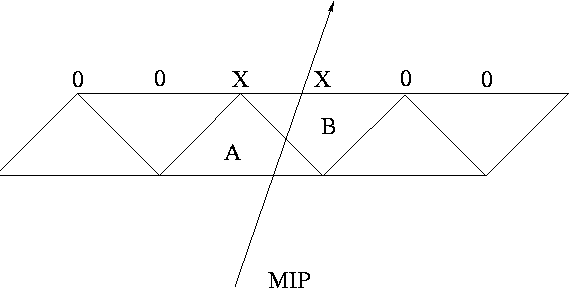
In this study, we looked for a 00xx00 hit pattern in the u-plane strips and an 00xx00 pattern in the v-plane strips that overlap with the u-plane strip with x-value, as shown in Figure 1.
Figure 1
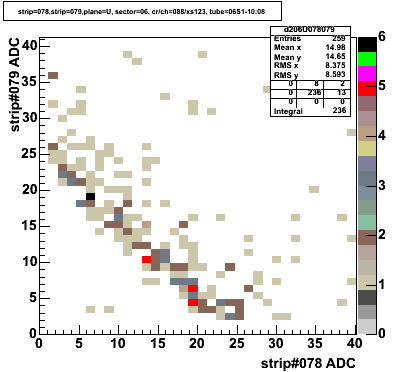
Plot 1 in Figure 2 shows the ADC of strip#79 versus the ADC of strip#78 for MC simulation of a 5 GeV π+ thrown uniformly across the tower 06TC04, and plot 2 shows the occurrence multiplicity of the 00xx00 pattern for plane-u strips & plane-V in coincidence (5000 events were used in this simulation).
Figure 2
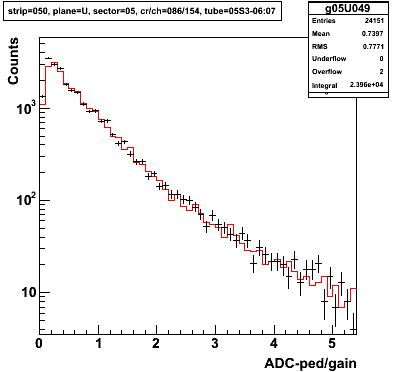
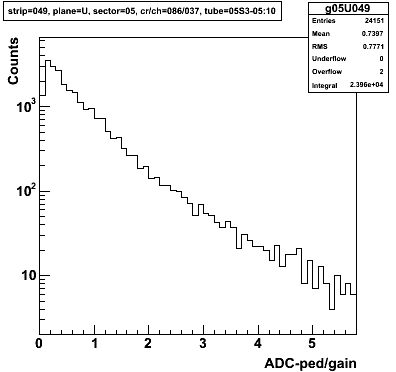
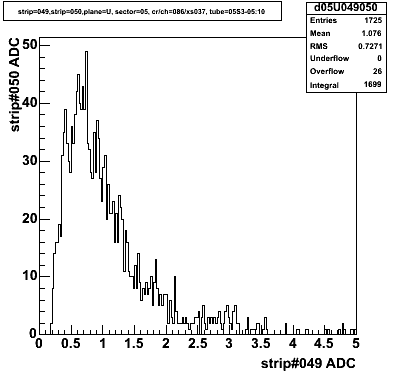
A similar study was done 800K muDst events taken with 62 GeV EEMC calibration data, plot 1 in Figure 3 shows the the energy (=[ADC-ped]/gain) for strip#49 (one of the strips that was used for the correlation plot) and the 2nd plot shows the energy spectrum for strip#50 (Red histogram) and the strip#49's energy overlapped.
Figure 3
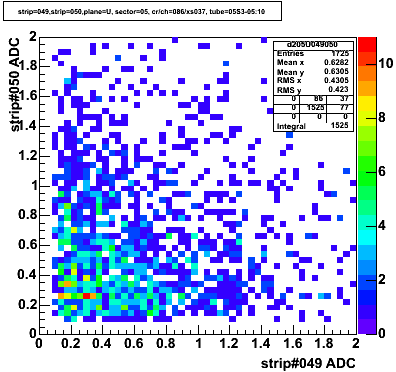
Plot 1 in Figure 4 shows the correlation between strip#49 and strip#50, while the 2nd plot shows a projection that was calculated according to : (E49+E50)/√2.
Figure 4 : labels should read energy instead of ADC.
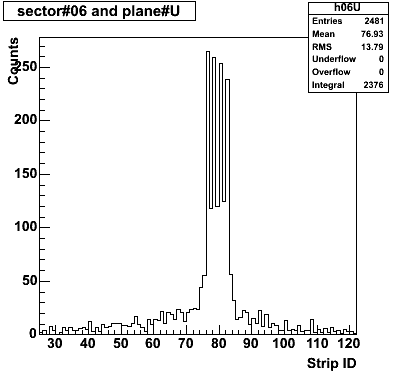
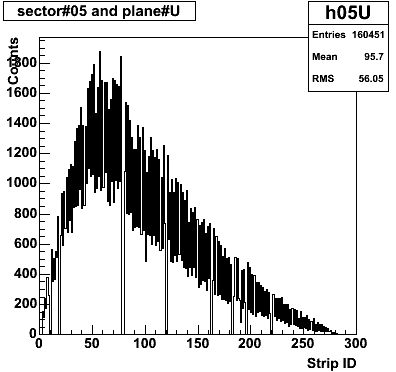
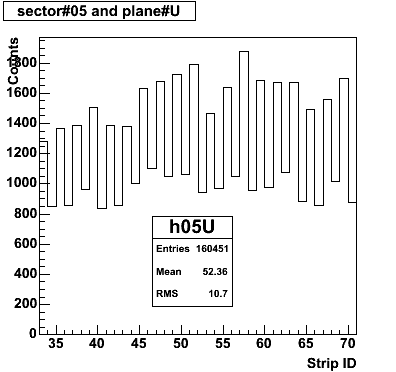
Figure 5 shows the occurrence multiplicity of u-plane strips where the 00xx00 pattern is required for both U & V plane in coincidence. The plot on the right is a zoom around strip 50.
This method seems to work reasonable for M-C events and energy correlation is well visible if energy resolution is 'infinitely good'.
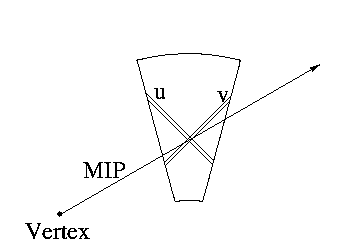
The pattern of interleaved high and low frequency of finding pattern 00xx00 vs. strip ID is well explained if MIP's are crossing SMD plane at an angle. This pattern is seen both for the M-C and for the data (fig 5).
The energy correlation is rather crude for real data, but quantization of energy in to few p.e. probably degrades the resolution.
This method identifies one MIP/sector per 300-600 eemcCalib events (depending on strip ID).