Let's meet tommorrow at the usual times (4 pm EST/1 pm PST) and places (Jim's and Spencer's offices).
Agenda:
Proposed structure of StPeCEvent, here
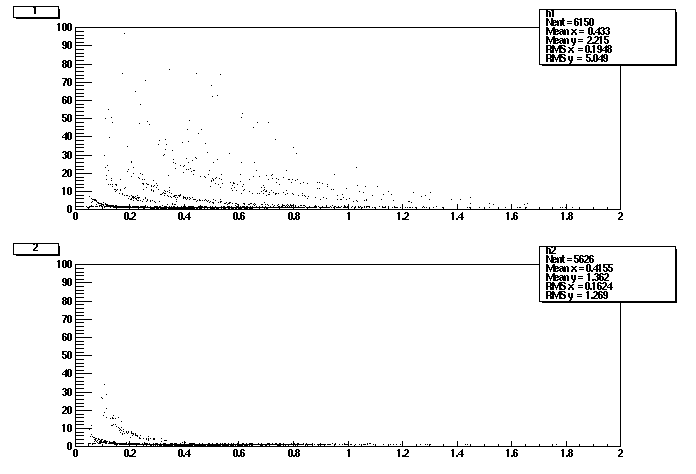
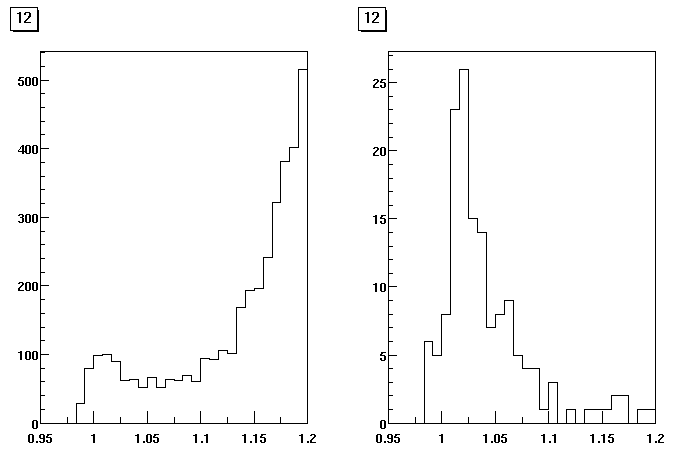
Some results from the half-field, vector meson data using TPC dE/dx...
First figure shows the dE/dx vs P(momentum). Y-axis: dE/dx (*10**6). X-axis: Momentum (GeV).
Upper plot (1) is for positively charged particles. Lower plot (2) is for negatively charged particles.

The second figure show the invariant mass distribution for 2-track events assumed to be kaons. The plot on the left hand side shows the distribution without any cuts on dE/dx. The plot on the right shows the distribution after a cut (very rough) around the kaon band. A cut on dE/dx reduces the background considerably (as expected).

Web Manager of this page: Joakim Nystrand .