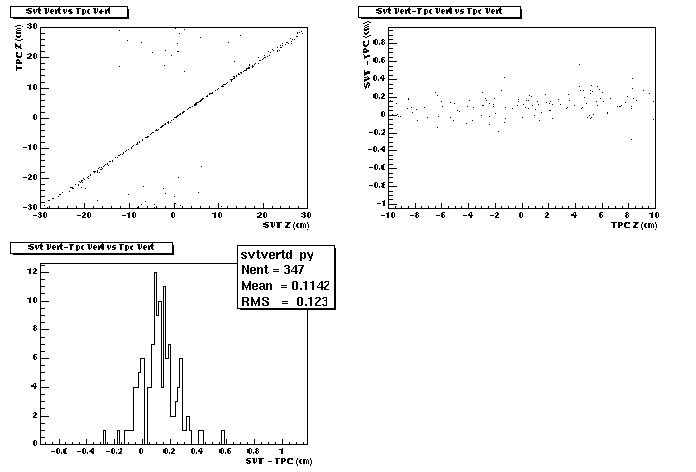
Fig 1 Shows
Top Left: The Z of the reconstructed "grouper" SVT vertex vs Z of TPC vertex using evr.
Top Right: Z_svt - Z_tpc vs Z TPC
Bottom Left: Projection onto y axis of plot 2
There seems to be a slight offset between the SVT and TPC of ~1mm. Otherwise the correlation seems great.
For more information on this technique see here..
For more general Year 2001 studies see here