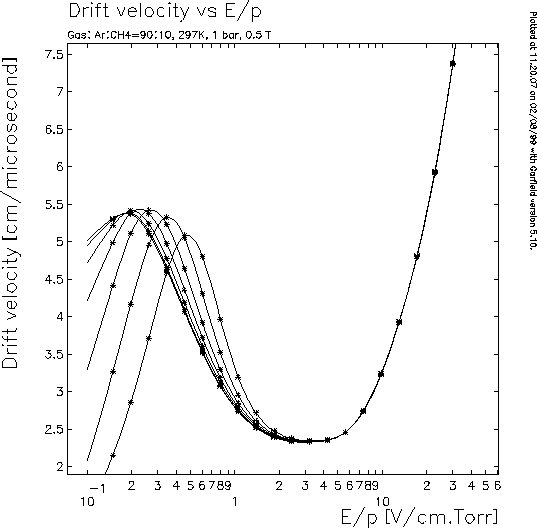
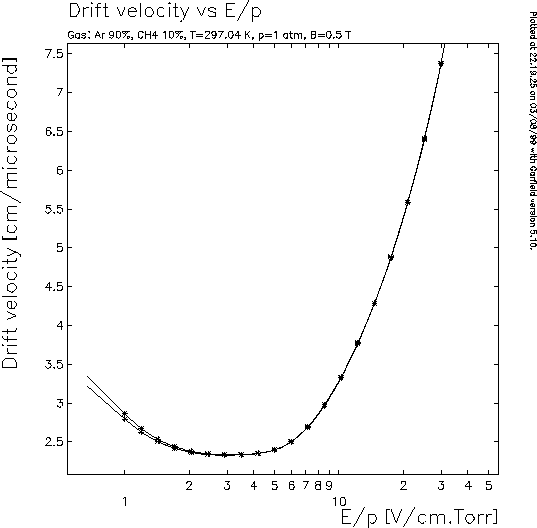
Electron drift properties for P10 can be estimated with Magboltz 1 [Steve Biagi, 1995]. The particular version used here was interfaced to Garfield [Rob Veenhof, 1995] for use in gas detector simulations. The plots were calculated by R.Bossingham; similar ones appear in SN0408.
As a function of "reduced field" (electric field divided by pressure, E/P), drift velocity is shown in the figure below for several alignments of E and B.


Electron drift velocity in P10 at 297K
and 1 bar with B=5 kG. The left-hand plot is for B aligned 0,
15, 30, 45, 60, 75 and 90 deg. from E, left to right.
For the high E region (right-hand plot), the alignments are 0
and 45 deg., left to right. The low drift velocities for E/P ~
2 are typical of the region
between the ground-wire and anode-wire planes, accounting for a shift
of the "effective detection planes" further from the central membrane.
In the TPC drift volume, E is nearly aligned with B, and large enough (E/P~ 0.19) that the drift velocity V is beyond saturation (dV/dE<0). This allows active regulation of drift time using E, compensating for factors such as variations in the argon-methane ratio or low levels of contaminants.
Away from the anode wires, a log scale (right-hand plot) is more appropriate, showing that V is nearly constant for E/P ~ 1.5-5 V/cm-Torr. Most of the shift of the effective detection planes occurs in this region.
The figure below shows the electron drift velocity in P10 V vs. E/P on a linear scale. The main drift region of the TPC corresponds to E/P ~ 0.19 V/cm-Torr, slightly to the right of the saturation peak for E and B parallel. In the higher-field region within ~500 um of the anode wires, V increases with E/P linearly, or almost as the inverse of the distance to the wire.
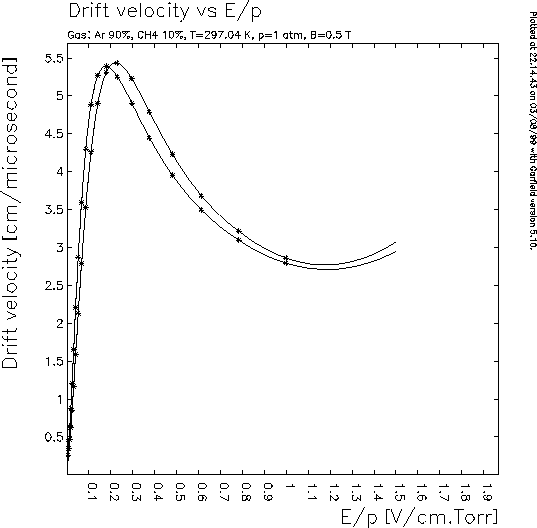
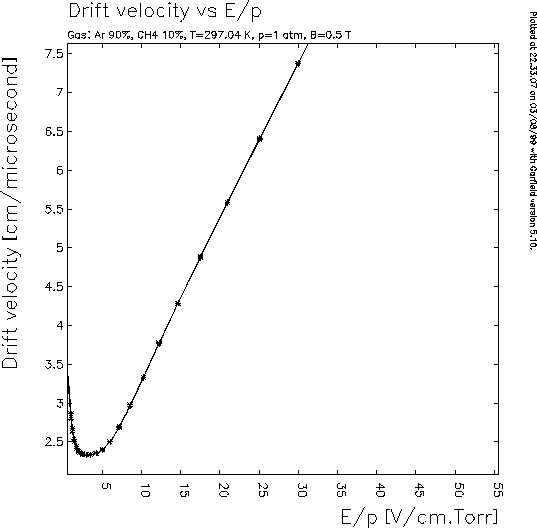
Electron drift velocity in P10 for lower and higher
E, left and right, respectively. The left curve
is for E and B parallel;
they are at 45 deg.for the right-hand curve (merging at high E/P).
For calibration purposes, another important property of P10 is the Lorentz angle, allowing an estimate of the size of the ExB effect near the anode wires. Finally, for completeness, plots of the Townsend and attachment coefficients also appear below.
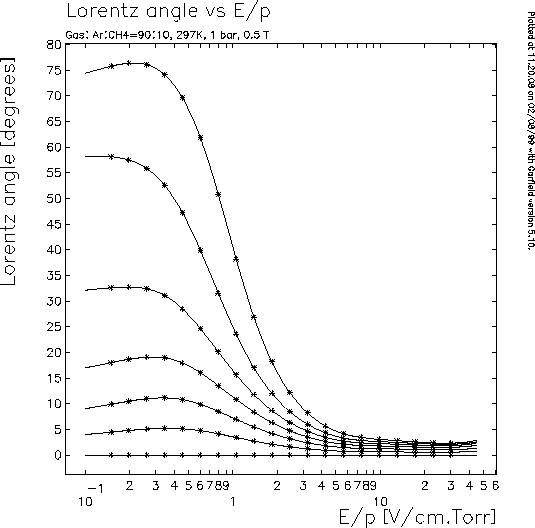
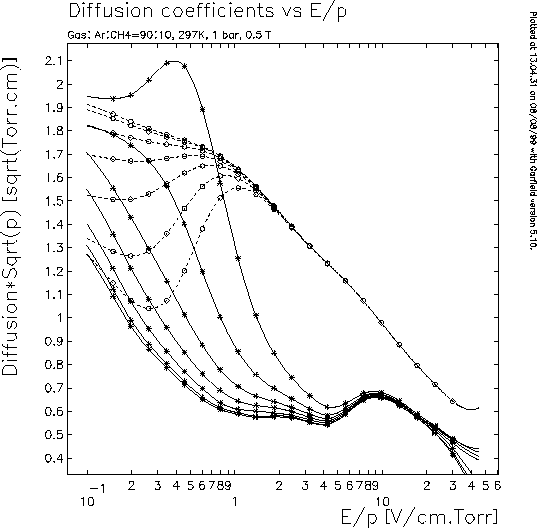
Lorentz angles (left) and diffusion (right) in P10
at 297K and 1 bar, with B=5 kG aligned 0, 15, 30, 45, 60, 75
and 90 deg. from E.
For increasing angle: Lorentz angles and transverse diffusion (*'s)
increase; longitudinal diffusion (open circles) decreases.
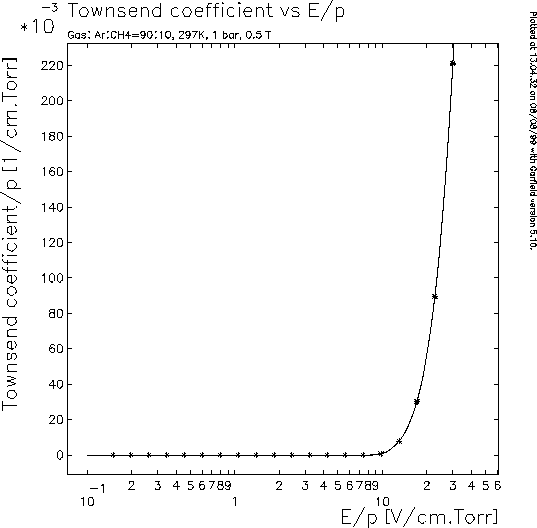
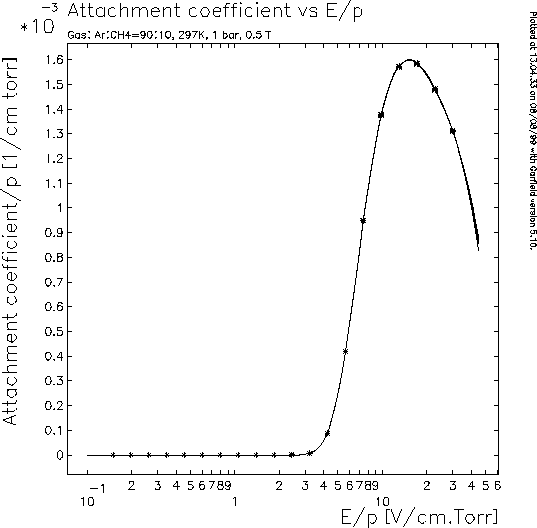
Townsend coefficients (left) and attachment coefficients (right) in P10 at 297K and 1 bar.
Page created by Roy Bossingham;
maintained by .
Last modified on June 29, 2000