The 1998-1999 operating voltages with the gating grid open translate into the nominal E fields shown in the table below. The field in the drift volume was calculated by Eric Hjort's applet; the other values are from Garfield, after the parameters were tuned to reproduce the field in the drift volume.
| E | Z Range | Drift velocity | |
| (V/cm) | (cm) | (cm/us) | |
| Drift volume | 148.05 | 208.7 | 5.396 |
| GG to gnd. wires | 216.76 | 0.6 | 4.969 |
Calculated TPC values for the nominal 1998-1999 parameters.
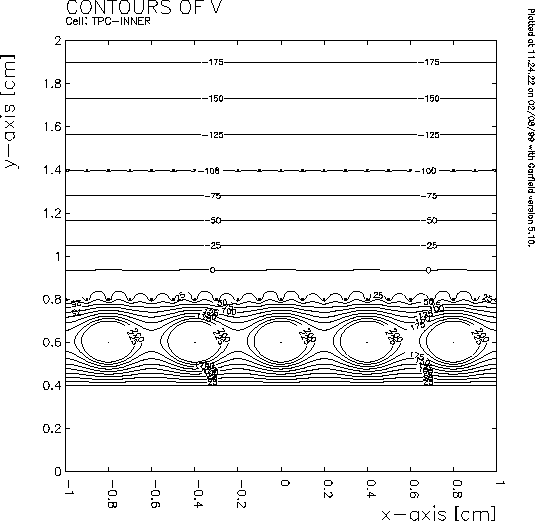
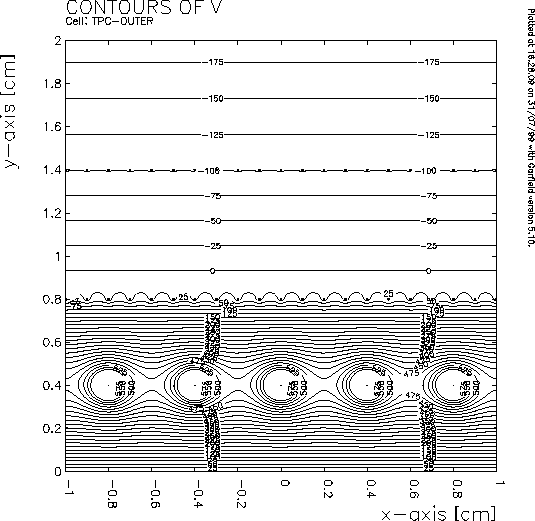
The uniform, 148 V/cm drift field region extends from the cathode to the gating grid, almost, followed by the higher, 208.7 V/cm field (still nearly uniform) to the ground wire plane; the field increases from there to the anode wires. This is demonstrated by the equipotential lines, shown in the figures below.


Equipotentials from drift volume to pad plane for the inner subsector (left) and outer subsector (right). Each plot is for a slice containing five anode wires. Note that these coordinates (y=0.4 cm and y=0.0 cm) are Garfield-related, rather than global TPC coordinates.
The calculated E-field contours near the anode wire, up to the ground-wire plane, are shown in the figures below. An interesting feature of much of the region is that E/P ~ 2, for which the drift velocity in P10 is insensitive to E/P.
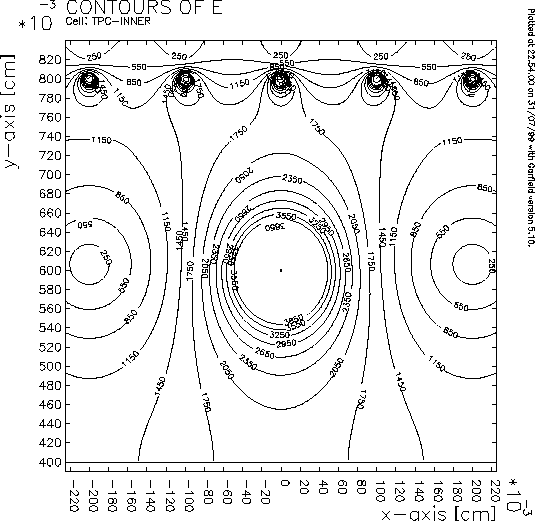
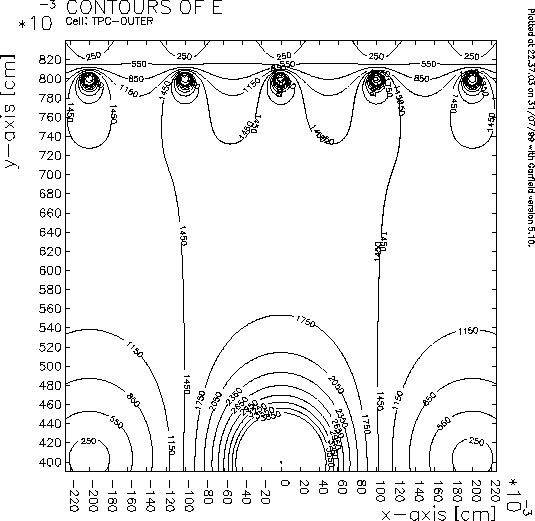
Electric field contours from ground wires to pad plane in the inner subsector (left) and from ground to anode wires in the outer subsector (right).
The electron drift lines in the figures below show the regions of the field usually sampled. Note that the angle of the drift lines to the TPC axis (unfortunately labeled y in the Garfield plots) never exceeds about 60 deg.
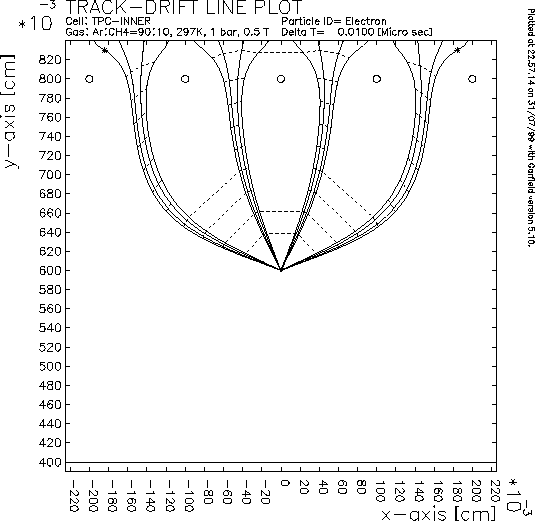
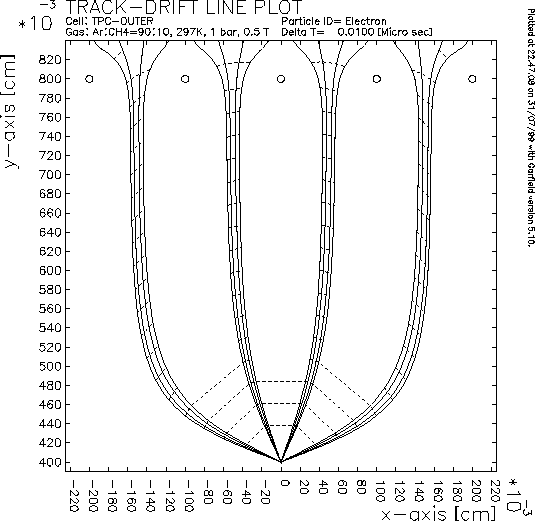
Electron drift to the anode wires in the inner subsector (left) and outer subsector (right). Isochrone spacing is 0.010 microseconds; note the extra 0.020-0.030 microseconds that electrons in the far channels require.
In discussing the electron drift time, it is helpful to know the E field in the transition regions near the ground-wire plane and gating grid; these are shown in the two pairs of figures below, respectively.
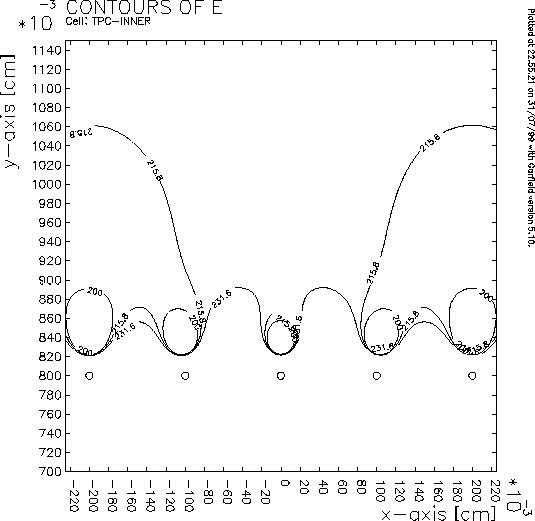
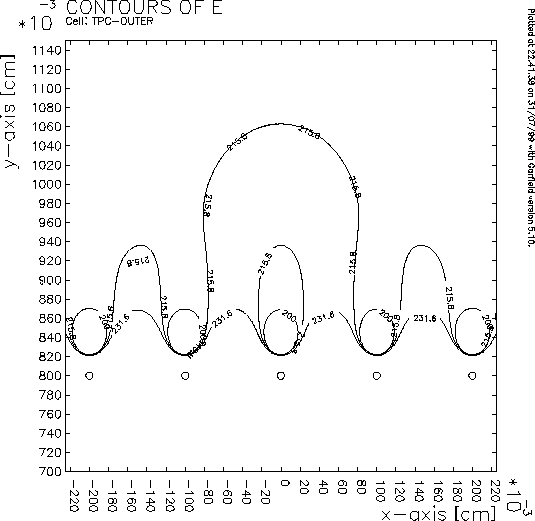
Electric field contours for an anode-wire cell in the inner subsector (left) and outer subsector (right); in both, the effect of the anode wire (below lower axes of plots) heals out a couple of millimeters past the ground-wire plane.
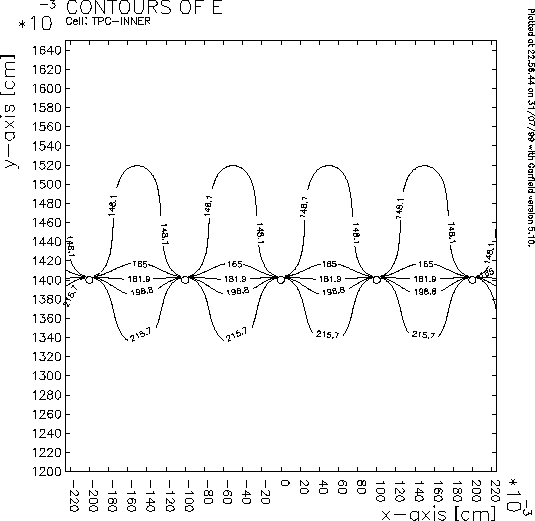
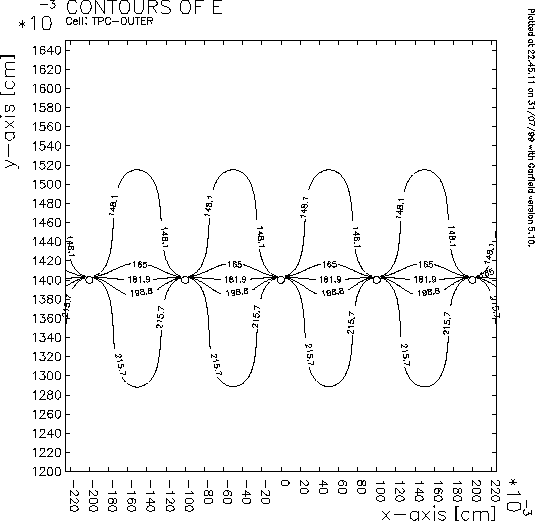
Electric field contours in the inner subsector (left) and outer subsector (right), showing the transition from the drift region, at top, across the gating grid.