Next: OTR/ITR-CATS on Real Data Up: Performance Comparison Previous: Reference Quantities Contents
During comparison many efficiency studies were performed, the results obtained for
the scenario one
![]() event mixed with 2
superimposed inelastic events are summarized below in Table 4.2.
event mixed with 2
superimposed inelastic events are summarized below in Table 4.2.
| Efficiency (%) | |||
| Set | CATS | RANGER | TEMA |
| Ref. |
97.4 | 93.6 | 90.8 |
| Ref. Prim. | 96.2 | 91.5 | 87.4 |
| Ref. Tracks | 92.3 | 84.6 | 82.7 |
| All Tracks | 55.6 | 40. | 44.8 |
| Extra | 33.3 | 13. | 21.7 |
| Clone | 2.1 | 2.5 | 0.8 |
| Ghost | 14. | 17.2 | 17.1 |
| MC tracks per event | 59 | 42 | 47 |
On average, the CATS efficiency is 97% for reference tracks coming from the target region.
The efficiencies for the other types of tracks are smaller, which can be attributed to
their average momenta being smaller than those of primary and ![]() tracks.
tracks.
The ghost rate is roughly 14%. It should be noted that the ghost rate at this level of
reconstruction is uncritical because ghost tracks are very likely to be removed at the
next steps, the magnet tracking or matching with VDS segments.
The overall clone rate and the absolute number of ghost tracks is lower for CATS,
on condition that CATS reconstructs many more soft tracks.
Table 4.3 shows reconstruction efficiencies
for all types of reference tracks for
![]() events mixed with 5
superimposed inelastic events.
events mixed with 5
superimposed inelastic events.
| Efficiencies (%) | |||
| Set | CATS | RANGER | TEMA |
| Ref. |
95.5 | 89.1 | 81.5 |
| Ref. Prim. | 93.1 | 87.7 | 77.1 |
| Ref. Tracks | 90.5 | 82.1 | 74.4 |
| All Tracks | 60.1 | 41.2 | 39.8 |
| Extra | 43.3 | 17.3 | 20.6 |
| Clone | 5. | 4.8 | 1.8 |
| Ghost | 18.4 | 21.6 | 22.8 |
| MC tracks per event | 119 | 82 | 79 |
In order to understand the dependence of the track reconstruction performance
on the track multiplicity, the reconstruction efficiency of reference tracks and the ghost
level were
measured with different numbers ![]() of superimposed inelastic interactions
exactly mixed. On average, the number of reconstructable tracks per event
scales linearly with the number of exactly mixed interactions, rising from
40 tracks for one interaction up to 320 for eight. For this test,
RANGER was taken as a reference. The results are summarized in
Fig. 4.8.
of superimposed inelastic interactions
exactly mixed. On average, the number of reconstructable tracks per event
scales linearly with the number of exactly mixed interactions, rising from
40 tracks for one interaction up to 320 for eight. For this test,
RANGER was taken as a reference. The results are summarized in
Fig. 4.8.
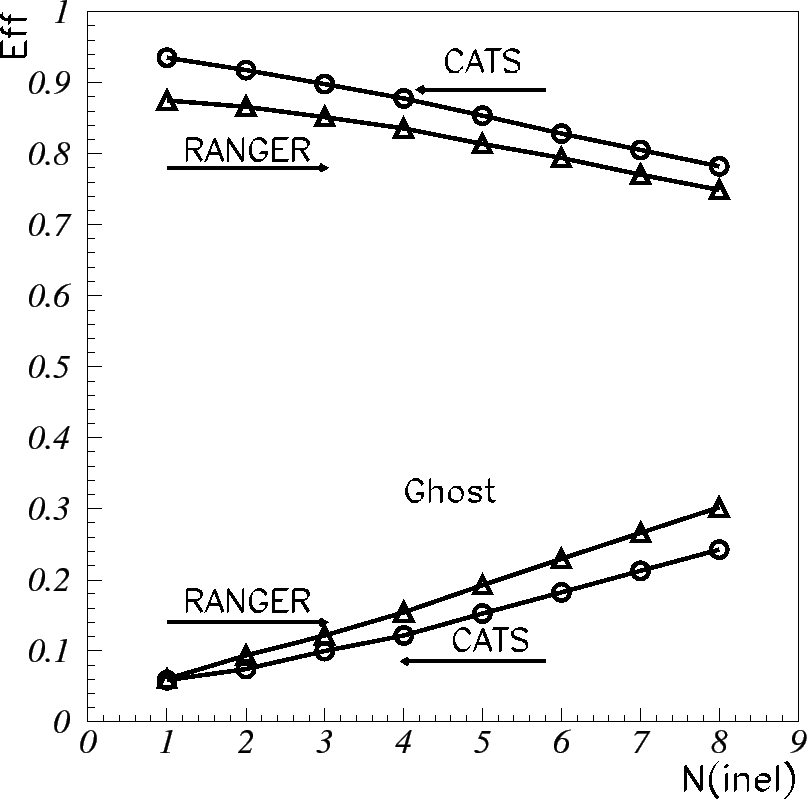 |
While the mean interaction rate was expected to result in four Poisson distributed superimposed interactions, the performance of CATS was investigated for up to 8 interactions. The reconstruction efficiency for reference tracks slowly decreases from about 93% to 78%, ghost rate grows from 6% to 23%. As can be seen, the efficiency and ghost level of CATS show the same trends as those of RANGER demonstrating the stability and robustness of CATS.
In order to estimate the accuracy of the track reconstruction algorithm,
track residual distributions are investigated at two planes: ![]() and
and
![]() , where
, where ![]() ,
, ![]() are the
are the ![]() -coordinates of the first and the
last hits of the reconstructed track, respectively. The reliability of the
track covariance matrix produced by the reconstruction algorithm is studied
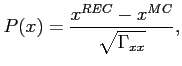
by investigating normalized residual distributions, using diagonal elements
of the covariance matrix for normalization. By definition, the normalized
residual (also called pull) of a track parameter, for instance
-coordinates of the first and the
last hits of the reconstructed track, respectively. The reliability of the
track covariance matrix produced by the reconstruction algorithm is studied
by investigating normalized residual distributions, using diagonal elements
of the covariance matrix for normalization. By definition, the normalized
residual (also called pull) of a track parameter, for instance ![]() -coordinate,
is
-coordinate,
is
| CATS | RANGER | TEMA | ||||
| Resolutions | OTR | ITR | OTR | ITR | OTR | ITR |
| 246 | 93 | 322 | 91 | 291 | 98 | |
| 3.7 | 1.4 | 5.0 | 1.4 | 4.1 | 1.4 | |
| 0.62 | 0.24 | 0.71 | 0.24 | 0.76 | 0.26 | |
| 4.73 | 1.79 | 6.96 | 1.79 | 5.39 | 1.87 | |
| Pulls | ||||||
| 1.59 | 1.11 | 1.37 | 1.10 | 1.45 | 1.06 | |
| 1.52 | 0.98 | 1.25 | 1.11 | 1.81 | 1.16 | |
| 1.16 | 0.93 | 1.25 | 0.89 | 1.18 | 1.15 | |
| 1.53 | 0.99 | 1.39 | 1.15 | 1.92 | 1.23 | |
| Hits/track | 31 | 23 | 26 | 21 | 31 | 21 |
Table 4.4 presents values of pulls and residuals for four
parameters ![]() ,
, ![]() ,
, ![]() and
and ![]() of properly reconstructed tracks and the mean
length of the tracks given in the number of associated hits for all three algorithms.
of properly reconstructed tracks and the mean
length of the tracks given in the number of associated hits for all three algorithms.
The pulls in the OTR are typically wider than unity. As was mentioned in [#!ranger!#] wider pulls are caused by inevitably unresolved left/right ambiguities, hits picked up from other tracks, and a simplified treatment of multiple scattering. However, it should be mentioned, that this problem only affects the accuracy of track parameter estimates, leaving the track reconstruction efficiency untouched.
The efficiency of L/R ambiguity resolution in the OTR is investigated for three
sets of tracks: lepton, primary and all reference tracks.
The evaluation method was based on the comparison of the reconstructed
sign of the drift radius
![]() with its true value
with its true value ![]() taken from simulated
data. Only significant errors in the L/R sign determination are taken into account,
i.e. those for which the residual
taken from simulated
data. Only significant errors in the L/R sign determination are taken into account,
i.e. those for which the residual ![]() is
is
As can be seen, CATS provides the most accurate resolution of L/R ambiguities for all types of reference tracks.
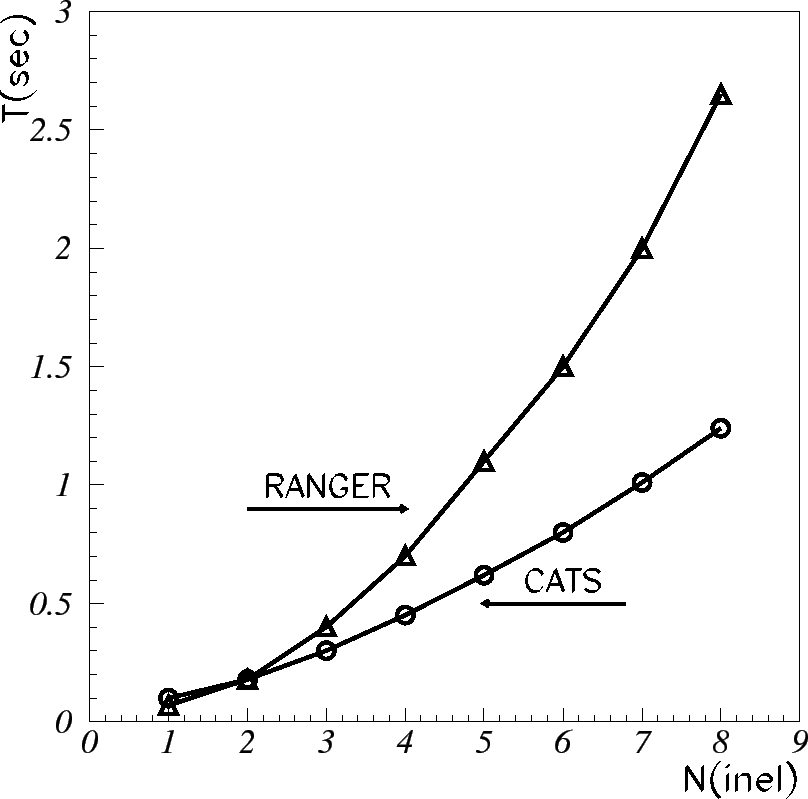 |
A PC with dual 500 MHz CPU Pentium III processor was used to measure the time consumption of the algorithm. The mean CPU time needed for CATS to reconstruct an event with 2 mixed interactions was about 240 ms. The computing time dependence on the number of superimposed inelastic events for CATS and RANGER is shown in Fig. 4.9. For CATS, the CPU time consumption shows only a very moderate increase, corresponding to an almost constant time requirement per track. The main reasons for the observed computational superiority of CATS are
Studies of ![]() reconstruction efficiency on simulated
reconstruction efficiency on simulated
![]() events mixed with 2 superimposed inelastic events,
have shown that CATS provides an about 10% higher efficiency for
events mixed with 2 superimposed inelastic events,
have shown that CATS provides an about 10% higher efficiency for ![]() mesons
than RANGER and 20% higher efficiency than TEMA with about the same mass resolution.
CATS also has shown a higher efficiency for
mesons
than RANGER and 20% higher efficiency than TEMA with about the same mass resolution.
CATS also has shown a higher efficiency for ![]() signal, it finds about 20% more
signal, it finds about 20% more
![]() than the other packages.
than the other packages.
Yury Gorbunov 2010-10-21