Next: Efficiency of the TC Up: Hit efficiency Previous: Efficiency of the Superlayer Contents
In order to avoid the bias which can appear if the pattern recognition
program uses hits of the investigated chamber, a special version of the
program was developed. Each event is reconstructed 24 times and every layer is
excluded once from the reconstruction, in the excluded layer the efficiency
estimation for all four chambers in the excluded layer is done. The parameters and covariance
matrices of the nearest end-points of segments are extrapolated to the
investigated ![]() plane.
plane.
For the analysis a sample of 30.000 - 50.000 events is used for each run. For each run a new mask is produced. The main contribution to the number of masked channels comes from superlayers MS10 and MS13 (up to 60%).
 |
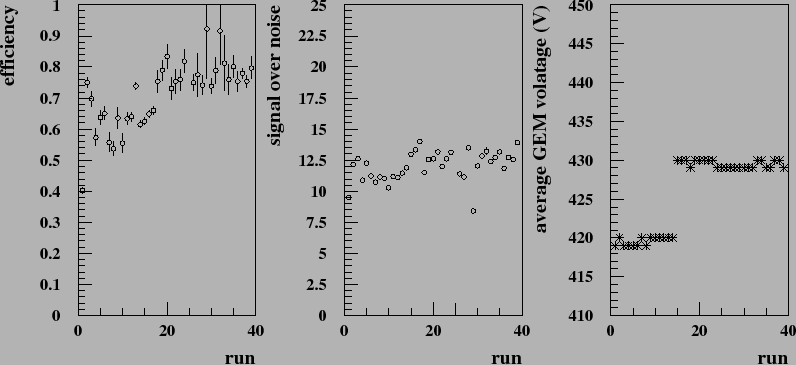
As an example, the efficiency, S/N and number of masked channels over time are shown in Fig. 5.9 for one of the relatively good chambers, MS10 +- 2. Some spikes are seen in the distribution of masked channels, they are caused by low voltage problems for half of the superlayer.
Drops of the high voltage in a group of chambers and problems caused by low voltage power supplies lead to the effect that even for properly working chambers it was not always possible to calculate the efficiency with sufficient statistic. In some areas the reconstruction program was not able to find enough hits in order to reconstruct segments.
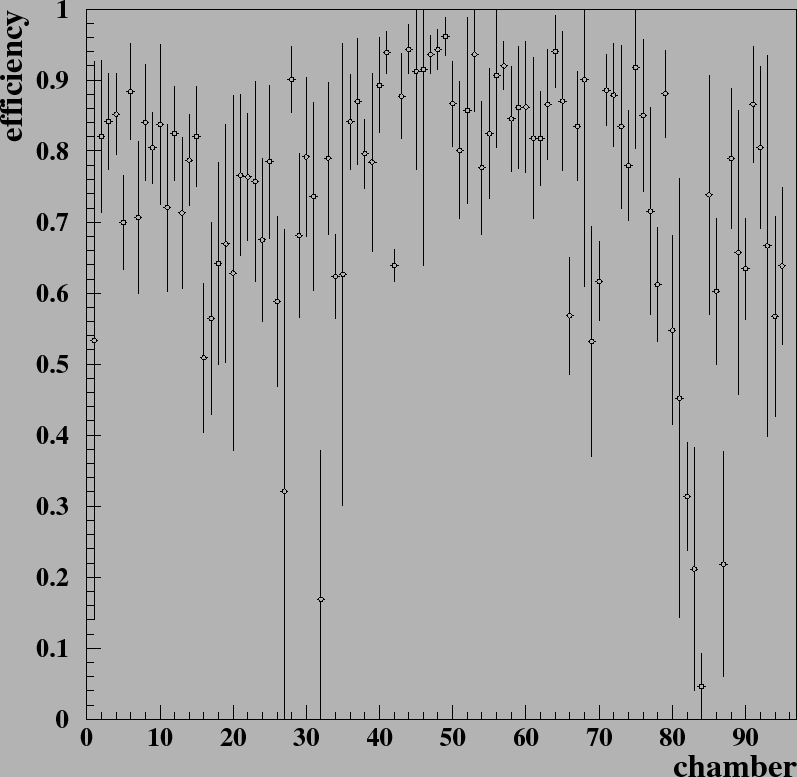
Figure 5.10 shows pure efficiencies for all chambers of PC superlayers. In the range from 0 to 31, chambers of station MS10 are placed, the range from 32 to 63 corresponds to the superlayers MS11 and MS12 and the rest are chambers of MS13. One can see that the chambers in MS10 and MS13 show rather low efficiencies and large variations.
 |
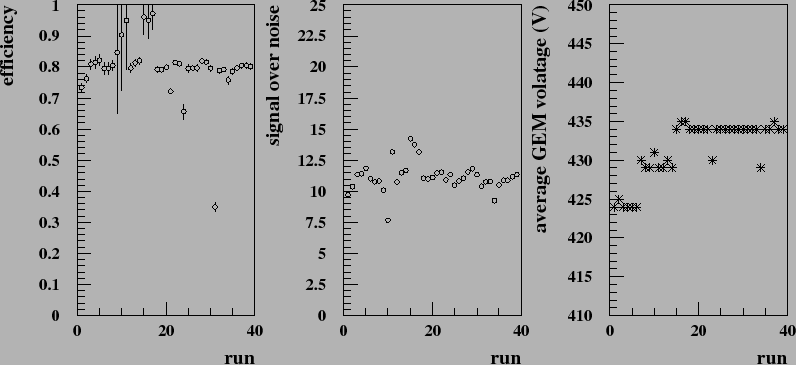
With the help of the obtained numbers, a GEM voltage tuning was performed in order to increase the efficiency of those chambers showing low efficiency. In some chambers the efficiency could be increased (in the order of 10%). Figure 5.11 shows the raise of the efficiency after GEM voltage increase for the chamber MS10 ++ 4.
 |
 |
Yury Gorbunov 2010-10-21