Next: Summary Up: Hit efficiency Previous: Efficiency of the TC Contents
In order to estimate systematic errors and to define the accuracy of the hit efficiency measurement algorithm a special tool for Monte Carlo data tuning was used. This tool allows to apply efficiencies measured on MC data simulation. For the tests, the following mean efficiencies were used:
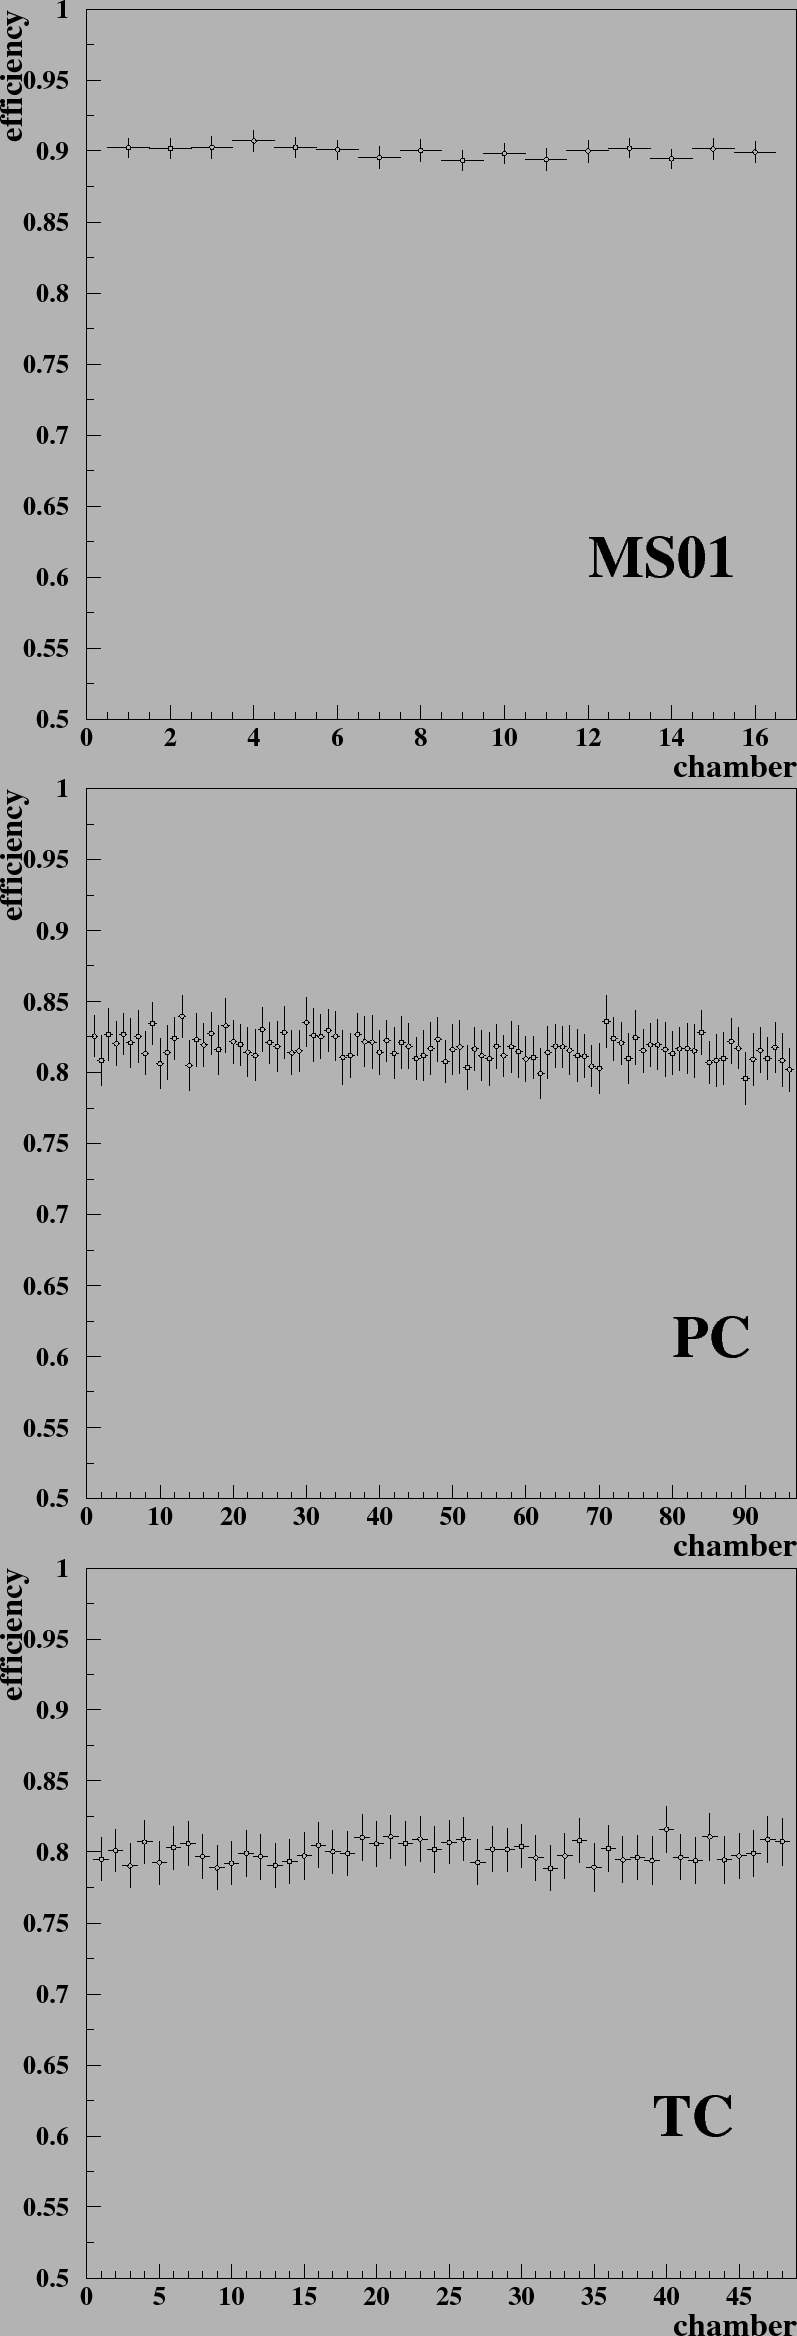
On MC the same algorithm for hit efficiency measurement is used as on real data. The selected sample of MC data contains 20.000 events and allows to achieve approximately 50.000 entries for each of MS01 chambers and 4.000 measurements for each of PC and TC chambers. The obtained results are shown in Fig. 5.14. There are three plots which illustrate the obtained efficiencies for MS01 superlayer, PC and TC area. The efficiencies are constant for MS01 within about 1% and compatible with the applied efficiencies. In the PC and TC chambers a deviation of about 2% are measured. These differences can be explained by the limited statistic. The obtained efficiency numbers are summarized in Table 5.2.
In order to check if the algorithm is able to deal with the ITR detector performances of 2002, with the large number of dead regions and observed low efficiency in PC region, a ``realistic scenario'' is applied:
 |
This shows that the pattern recognition program and the routine for efficiency estimation are robust enough to handle the real data and able to deliver reliable results.
|
Yury Gorbunov 2010-10-21