Random Walk
These are the first results for my simulation for the signal distribution on a grid of XxY pixels.The distance from one pixel center to the next one was chosen to be 20 um. The pixel size was set to 2x2 um^2. The depth of the epi layer was set to be 9 um.
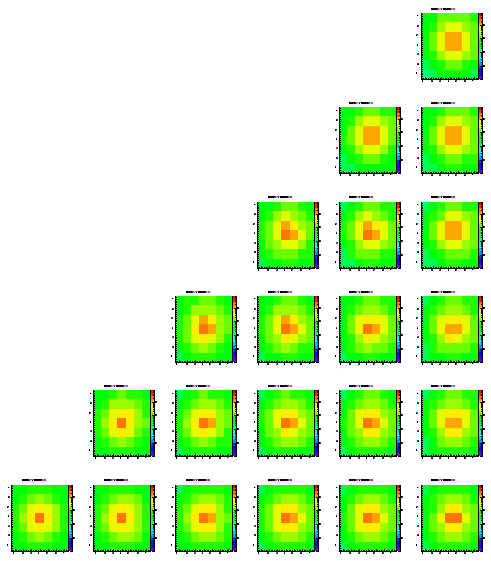
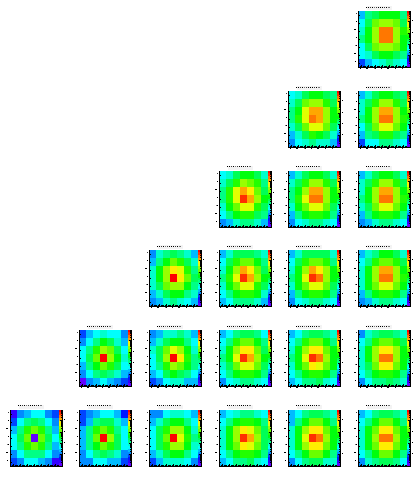
The charge was generated at (6*7)/2*6 positions within the epi layer (right-angled triangle with a cathetus of 6 positions = 6*(6+1)/2 positions starting from the center of the layout (just below the center pixel) and extending to the middle between the center pixel and its upper right neighbor; 6 layer (= levels) in the z direction: level0 being the 'top' layer (= right below the end of the epi layer) and level5 being the bottom layer (in this case at -9 um)).
At each of these postions I generated 100.000 'particles' (= electron/hole pairs). For each step I randomly chose the x, y, and z step size regarding to a Gaussian distribution centered around 0 with a width of 1 um. These 'particles' could do up to 1.000.000 steps to reach a pixel. (In fact every charge carrier was collected within about 30.000 steps, but this was unknown before the run.) When one step was about to take the 'particles' out of the epi layer (but not within a pixel) I generated a 'new step'. This is something (but not quite) similar to a reflection at the boundaries of the epi layer.
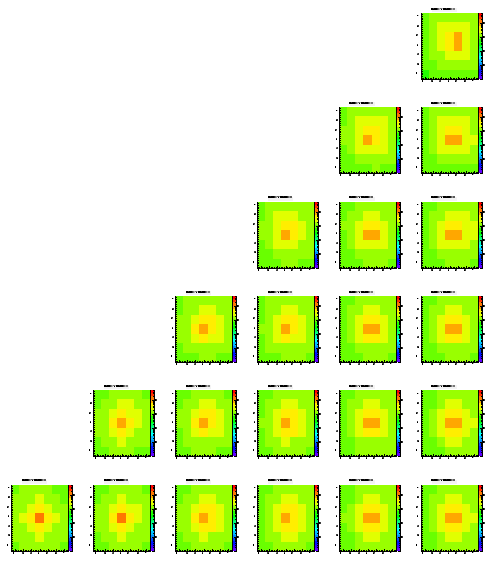
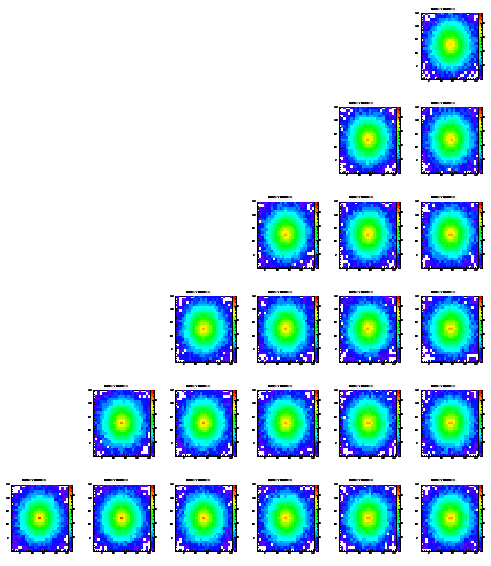
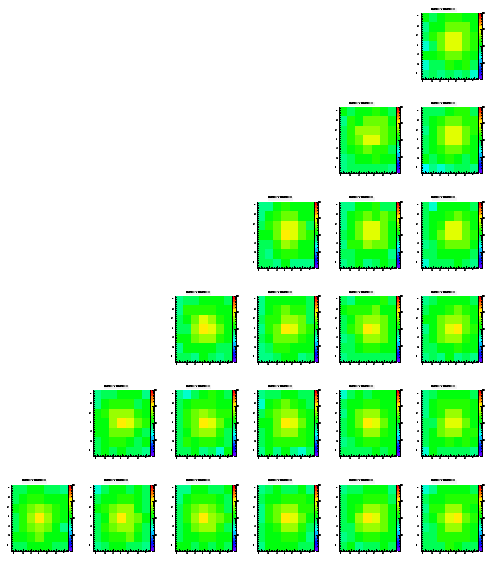
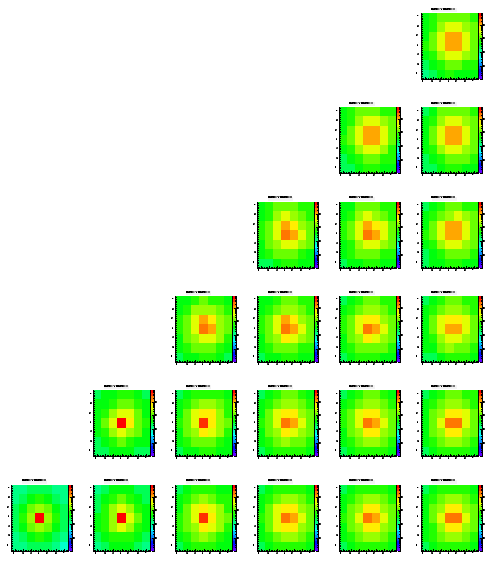
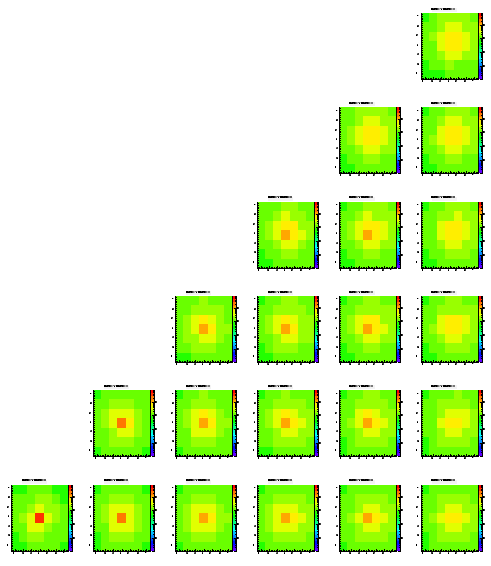
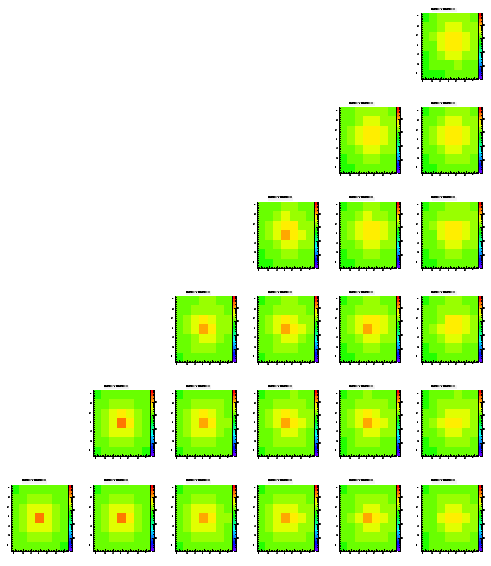
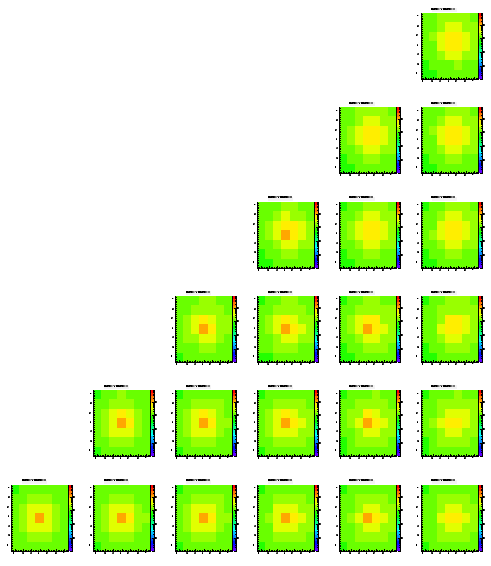
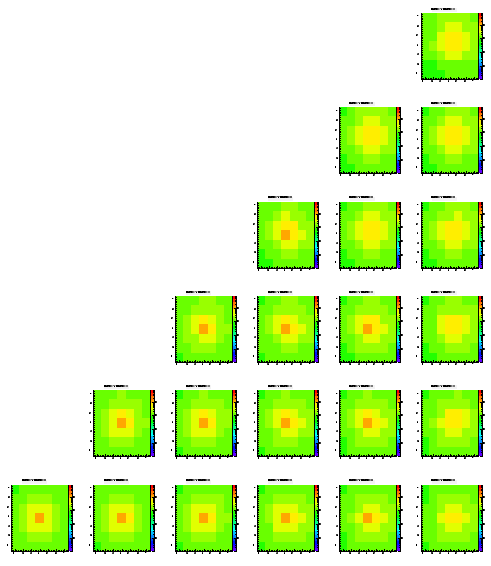
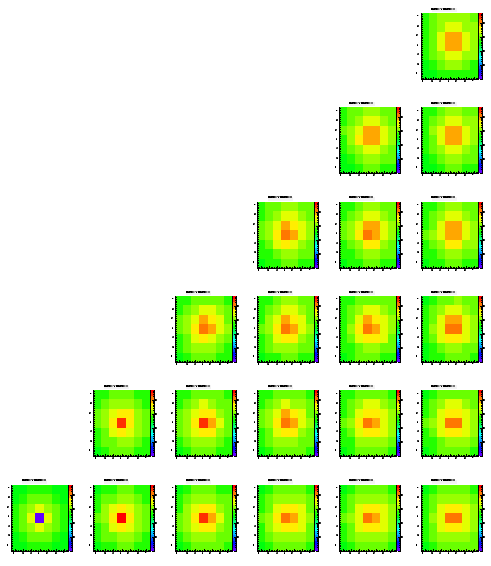
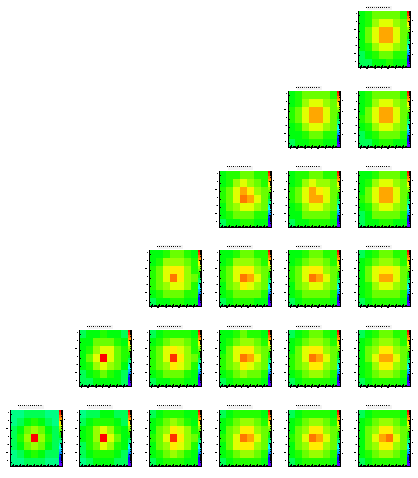
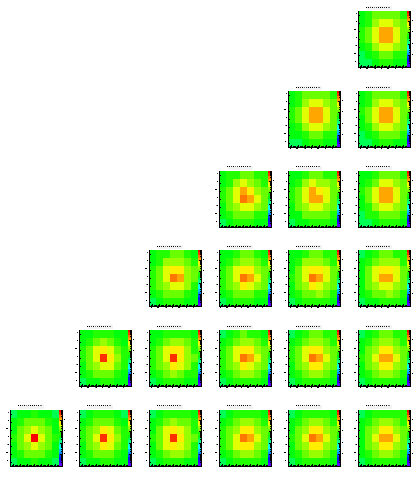
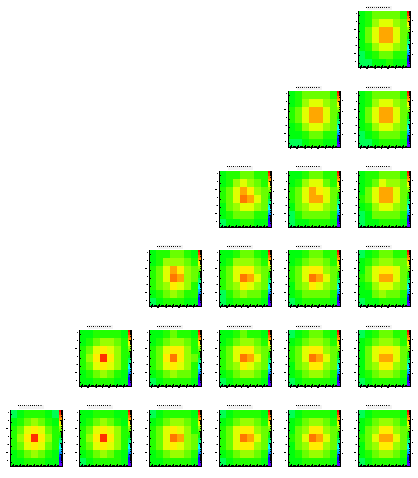
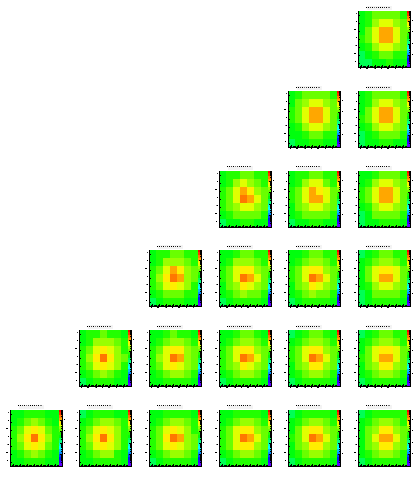
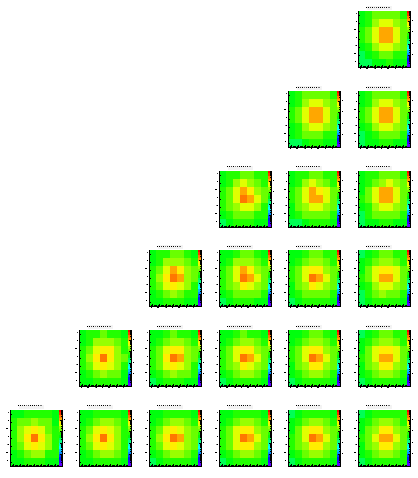
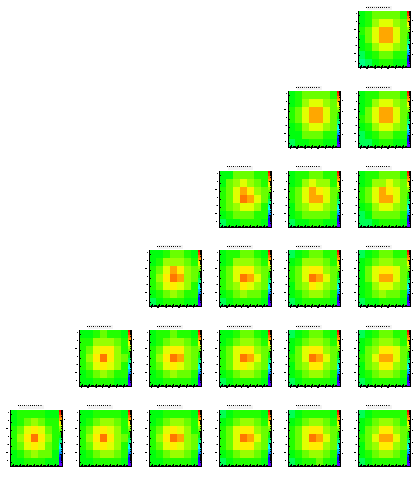
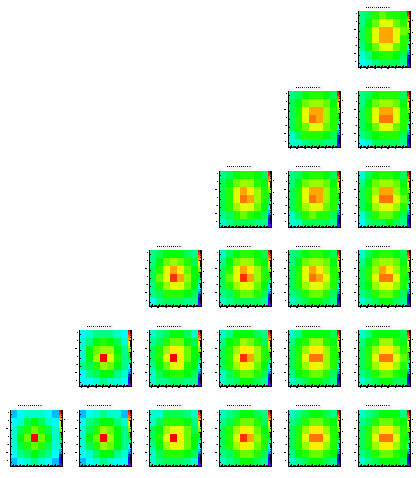
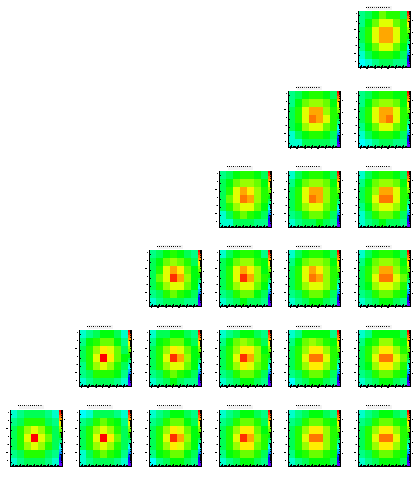
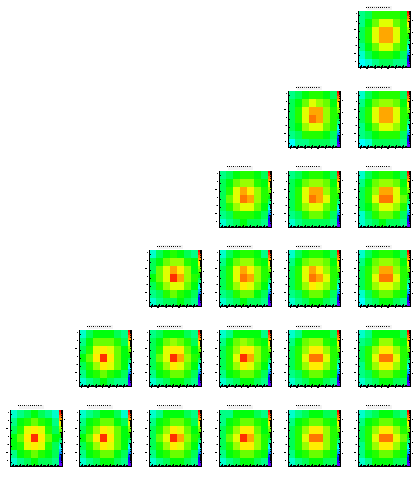
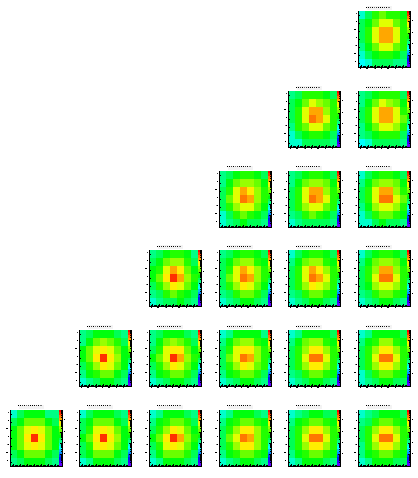
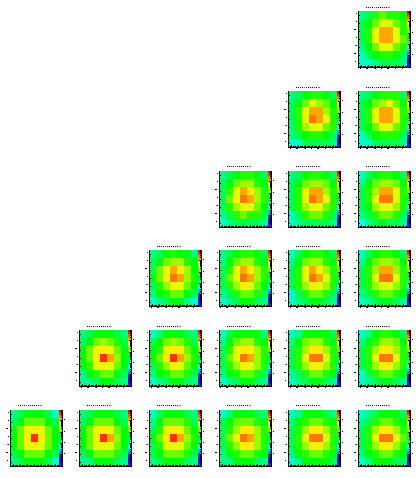
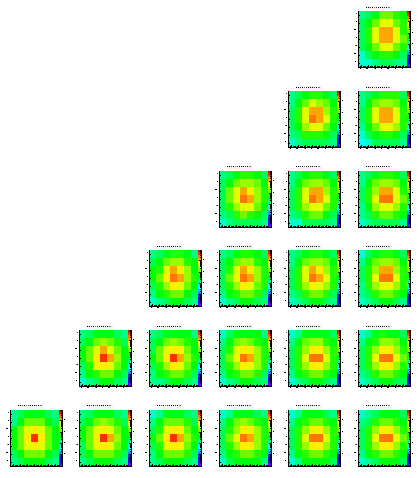
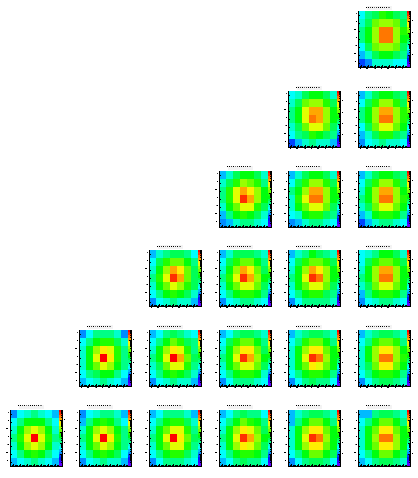
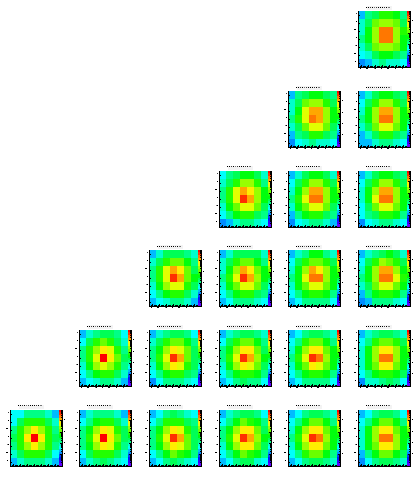
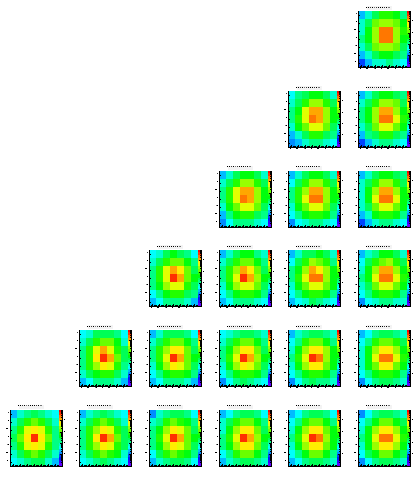
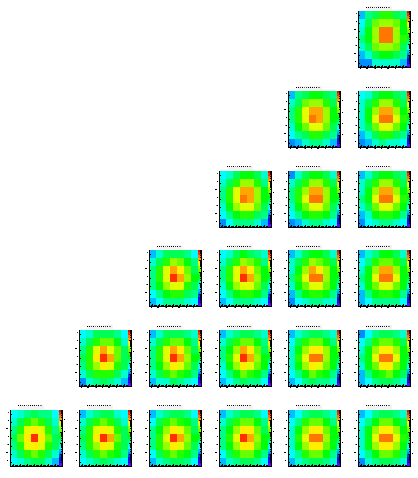
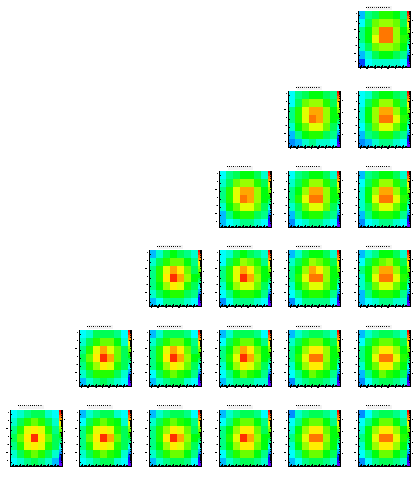
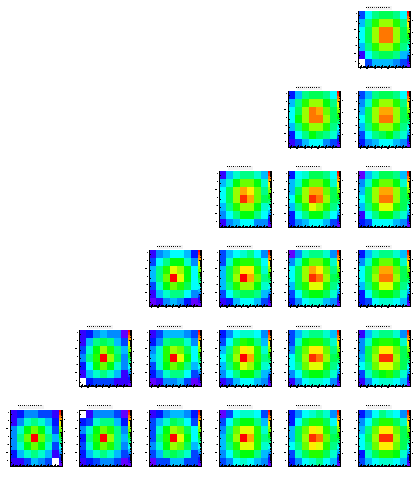
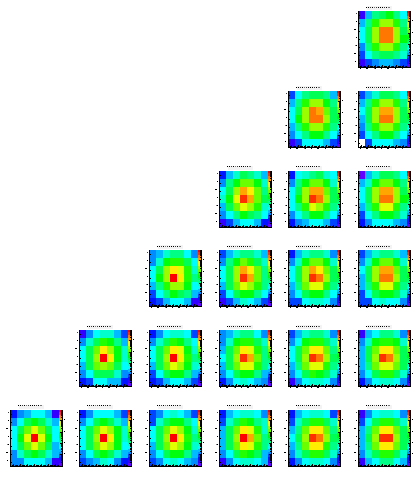
The following pictures show the distribution of the charge on the different pixels of an array of 7x7. Each histogram is in log scale, i.e. it's hard to read them quantitatively. These plots are just ment to show that the method works at all. While the different positions within the pictures represent the origin (in x and y) of the charge the different pictures show the different levels (z direction), starting from level0 which is the closest to the pixels.
The scale is the same for all histrograms, i.e. you can compare the different colors/heights of the peaks easlily. Note that each histogram contains exactly 100.000 entries.
While most of the histograms look like expected there are some asymmetries visible, still (look at the upper right plots, which should be symmetric always). In addition you can see some edge effects when the origin of the charge is moving towards the boundaries of the epi layer.
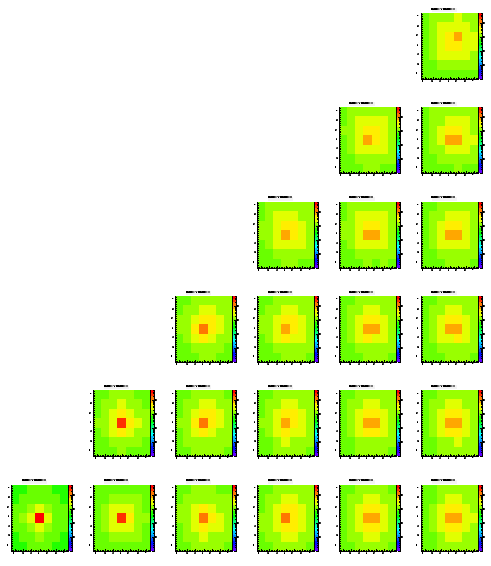
Level 1

Level 2
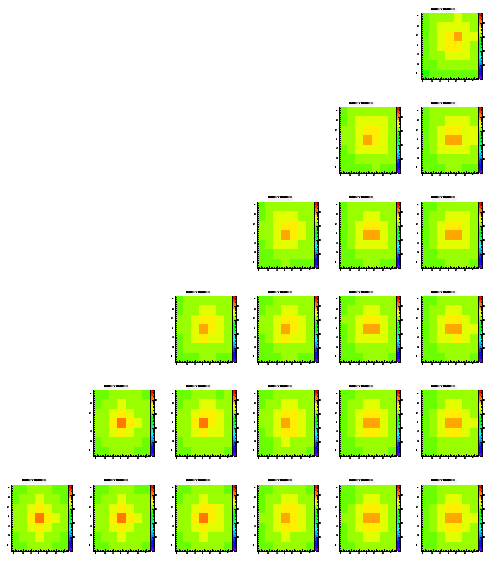
Level 3
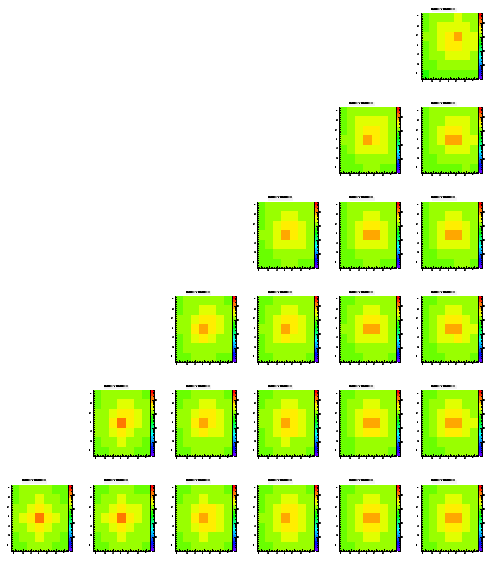
Level 4
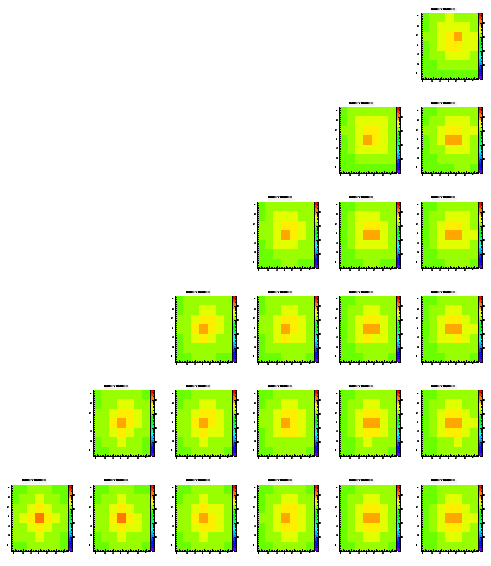
Level 5
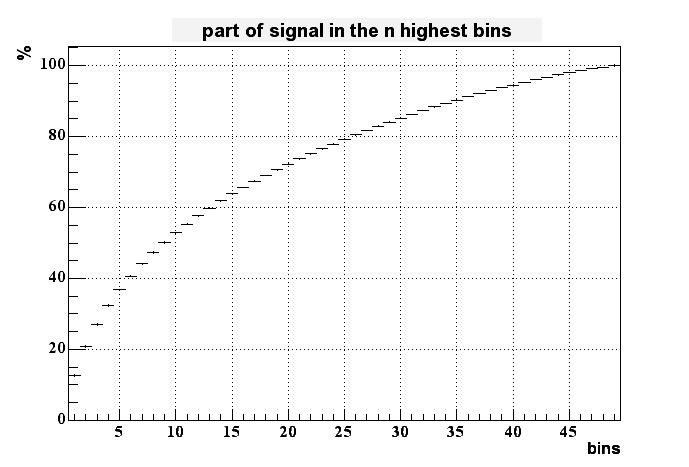
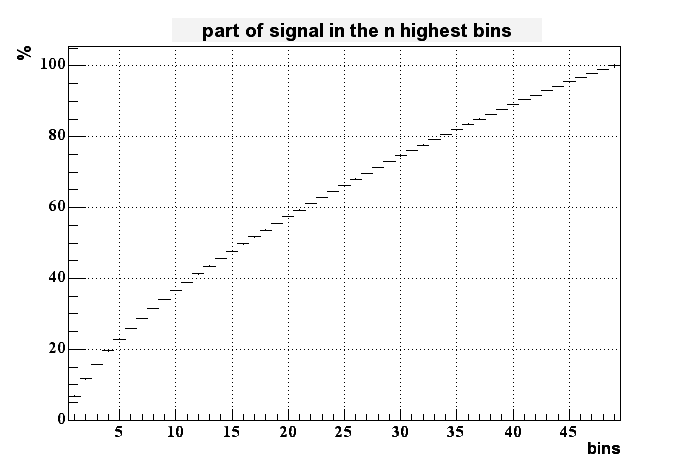
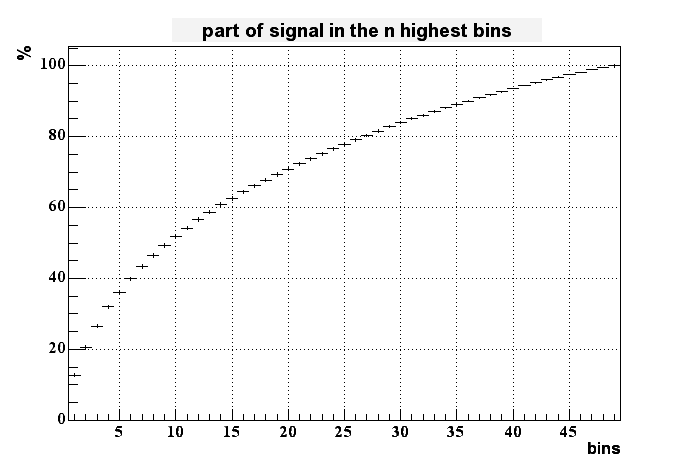
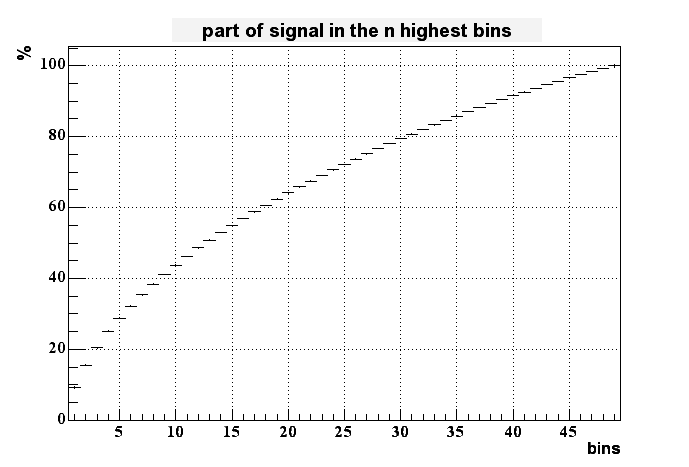
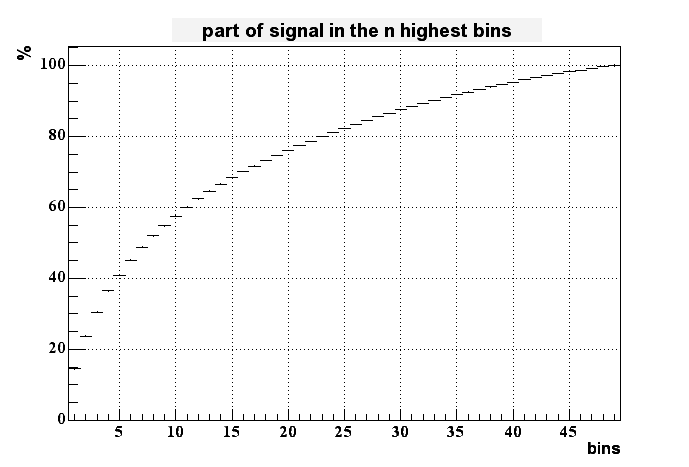
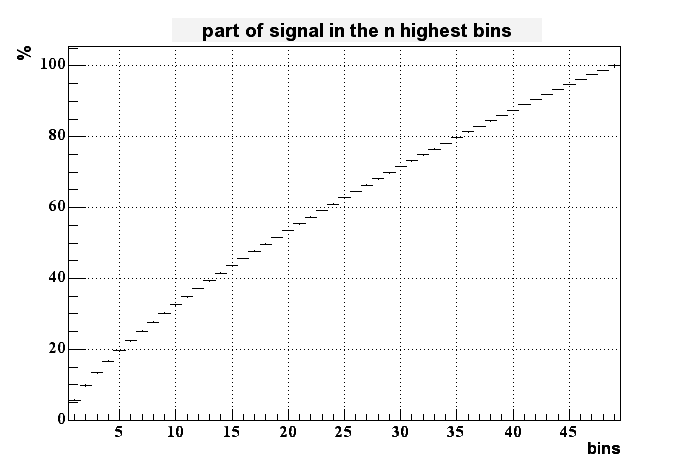
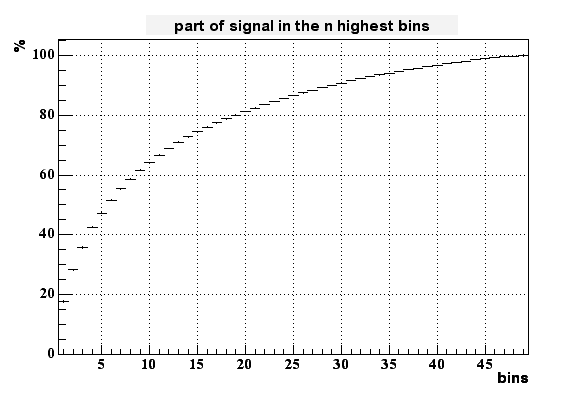
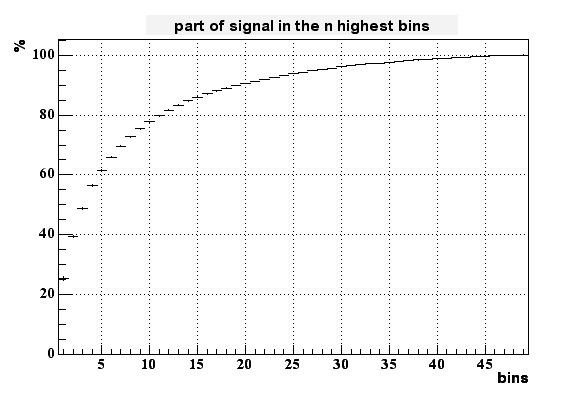
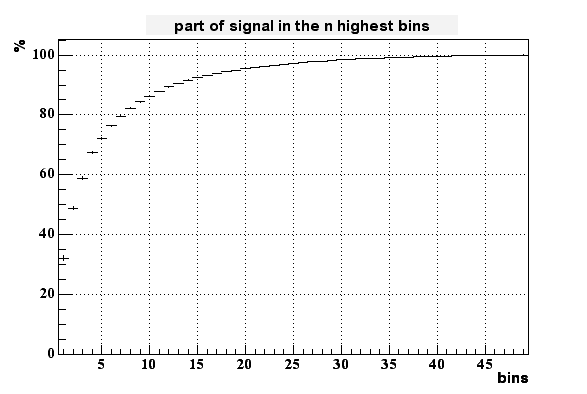
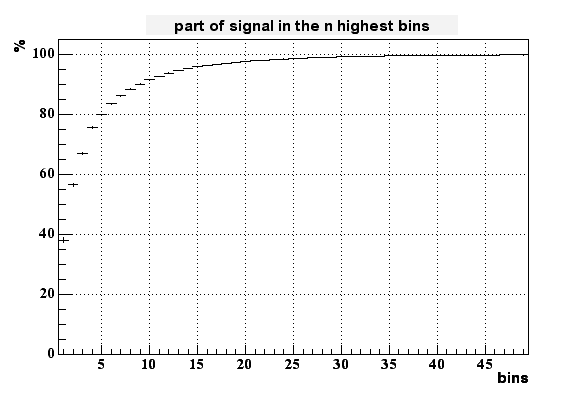
To measure something like the size of the peak I added the signal of the highest bins together. The next plot shows the percentage of the full signal which is collected in 1 up to all 49 bins.

Less than 8% of all the charge is collected in the highest bin. It takes up to 6 bins to collect 30% of the generated charge. This means that in this model the spread of charge is much broader than in reality. Derek Shuman's results for the finite element analysis looks much better in this respect.
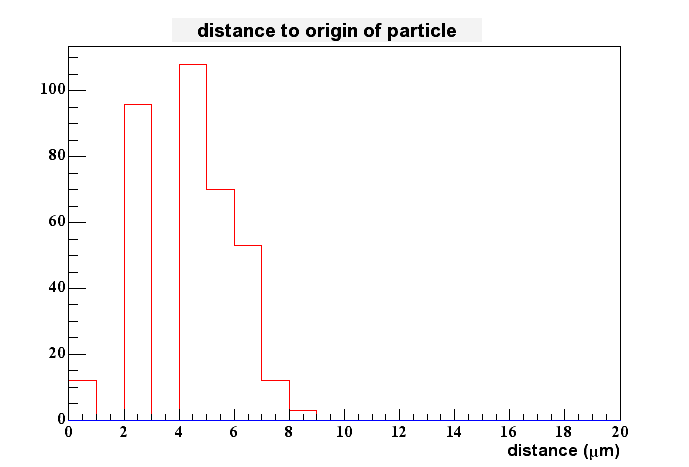
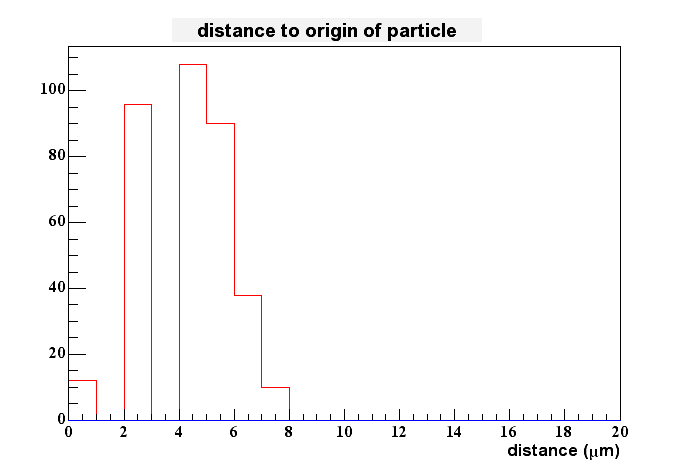
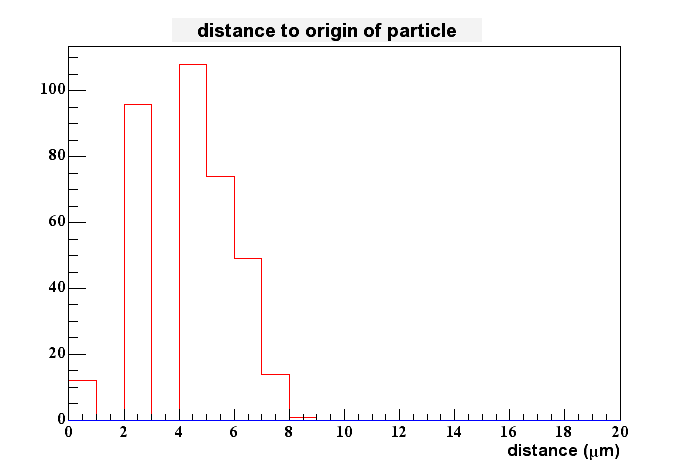
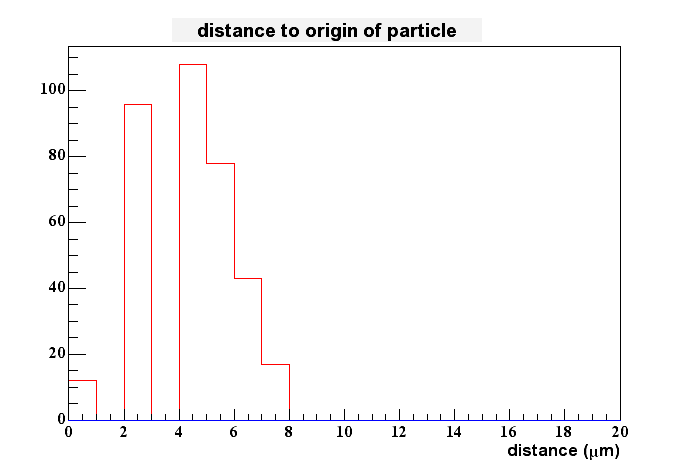
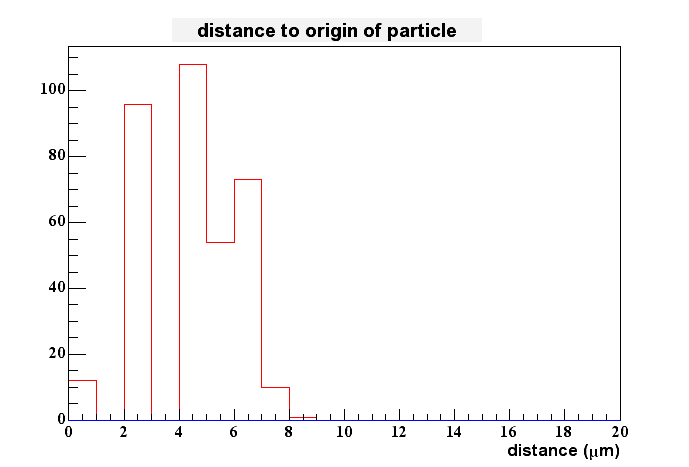
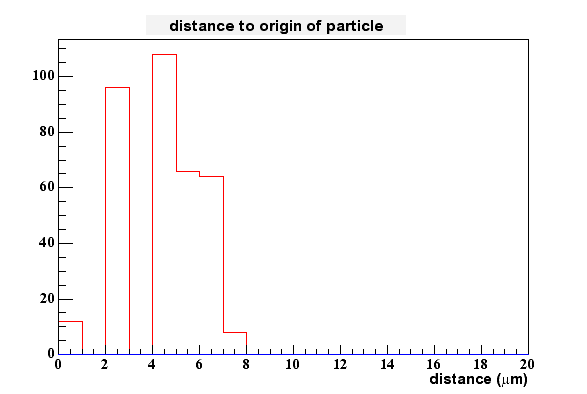
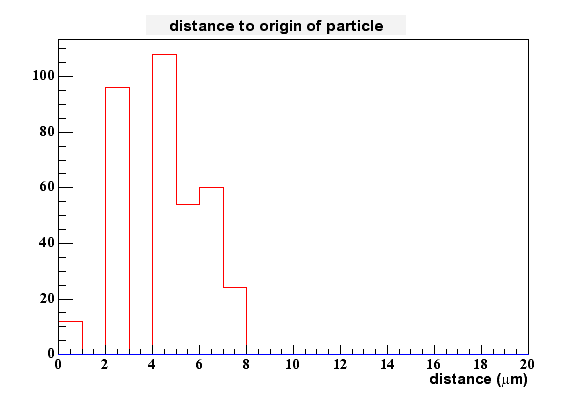
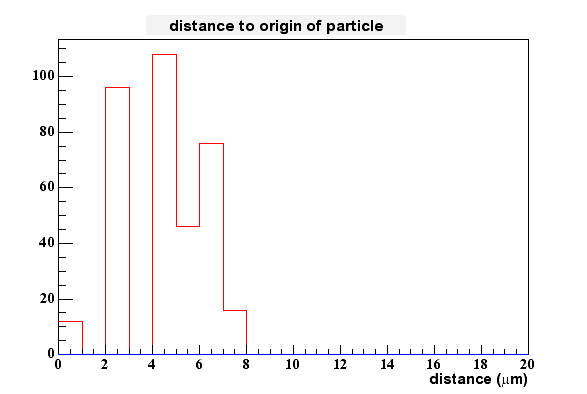
I tried to see if we would gain something by fitting the peaks with a Gaussian. This didn't work very well, since the distributions aren't gaussian at all. I even have problems to determine the peak location better than by locking at the highest pixel only. Therefore I stopped these efforts for now, i.e. I assume that the hightest pixel gives me the best estimate of charge generation in the epi-layer in x and y. The 2D-spatial distance between this measured value and the real one is shown here:
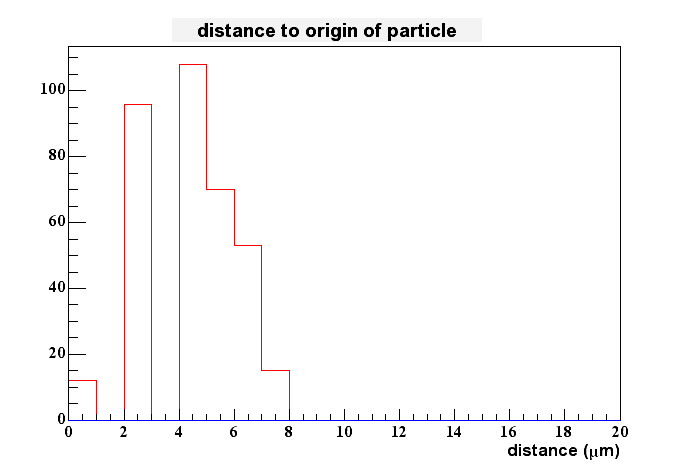
The maximum sits at about 5 um which is what you would expect when the pixel spacing is 10 um.
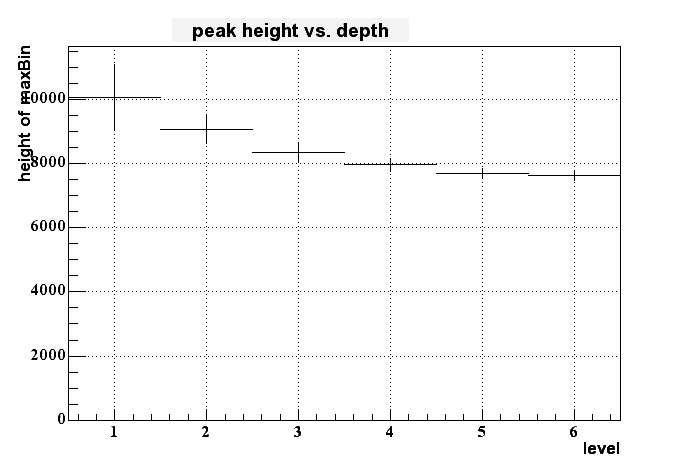
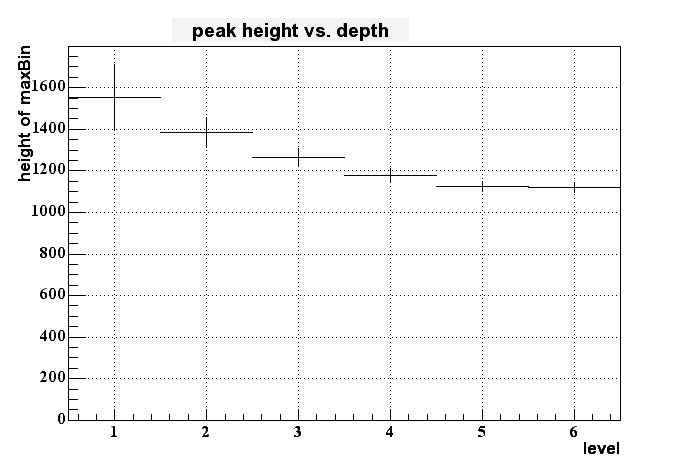
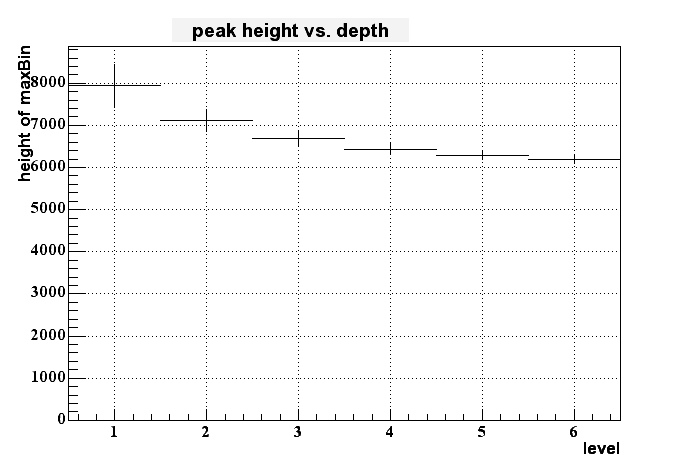
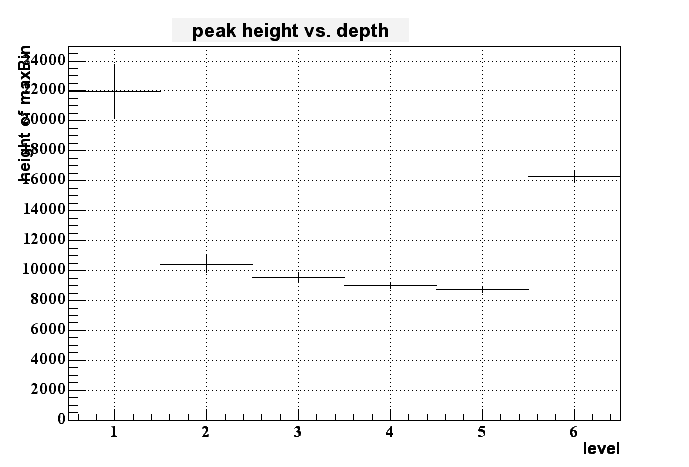
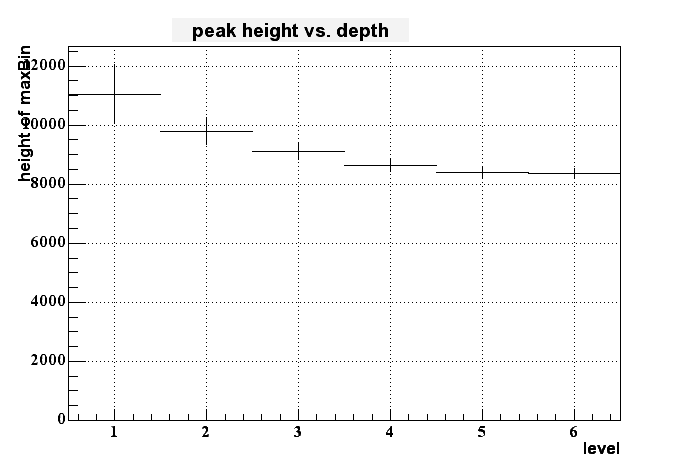
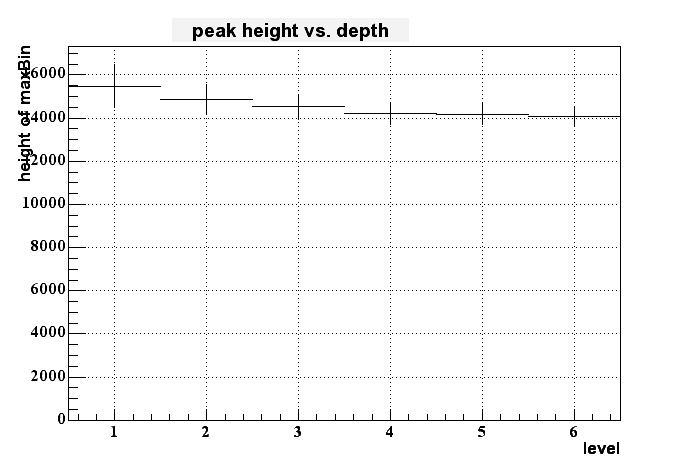
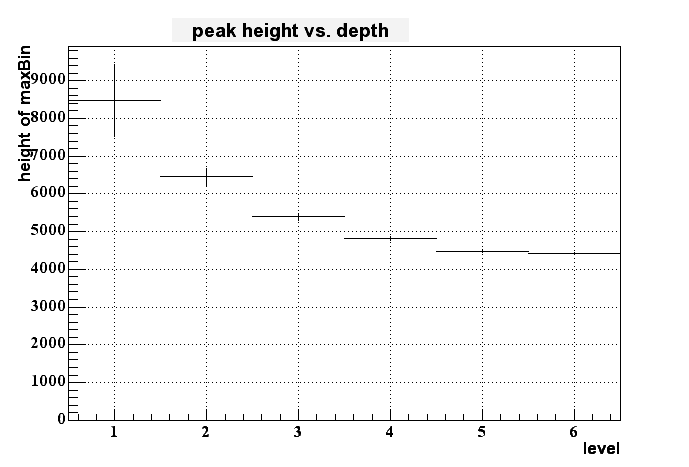
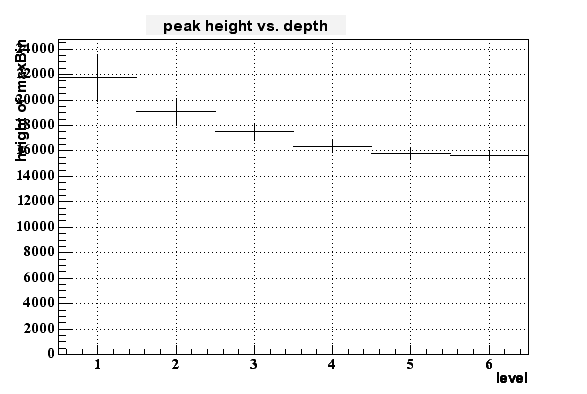
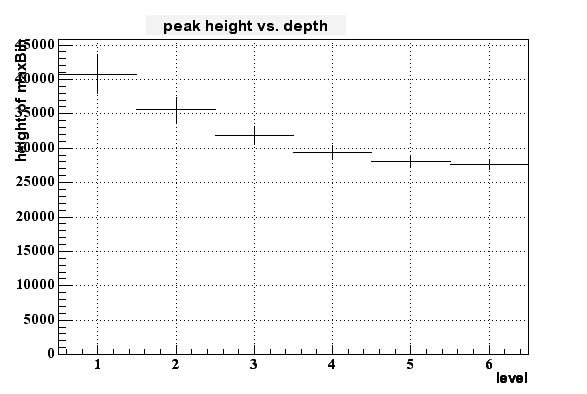
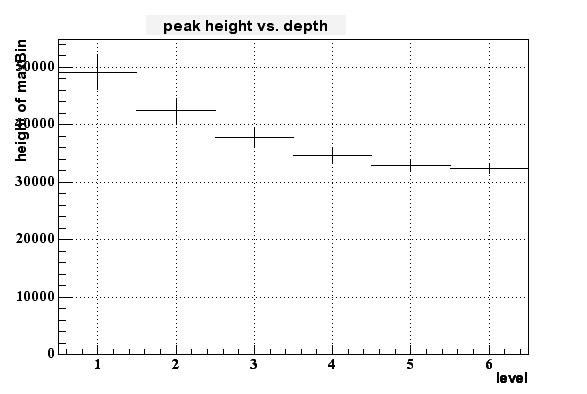
If I then look to the dependency of the pixel height to the depth of the charge generation (in terms of 'level', where 1 means right at the border of epi-layer to pixel and 6 means at the deep end of the epi layer (at -9 um in this case)) I get the following histogram:
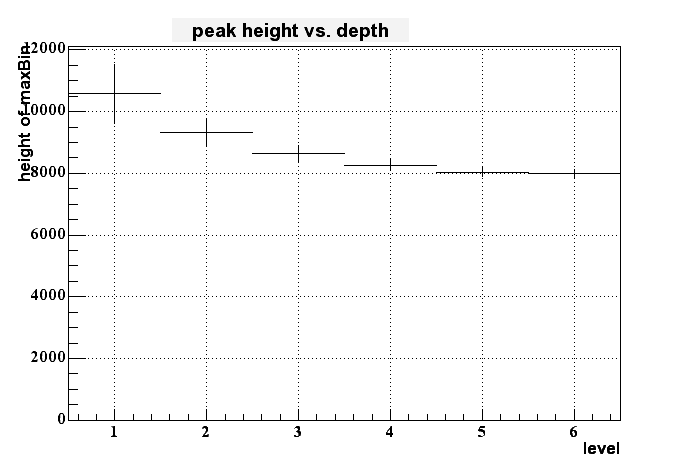
On can cleary see some dependency - the signal gets smaller for longer distance from the pixel within the epi layer - but this dependency isn't very strong. But it looks like to be possible to distinguish between the upper third and the lower 2/3 of the epi layer.
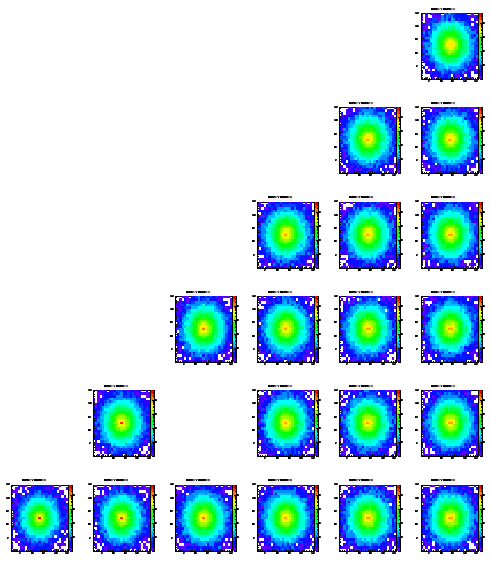
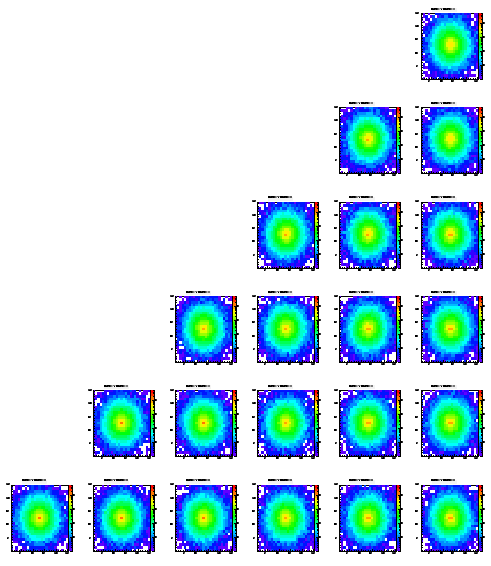
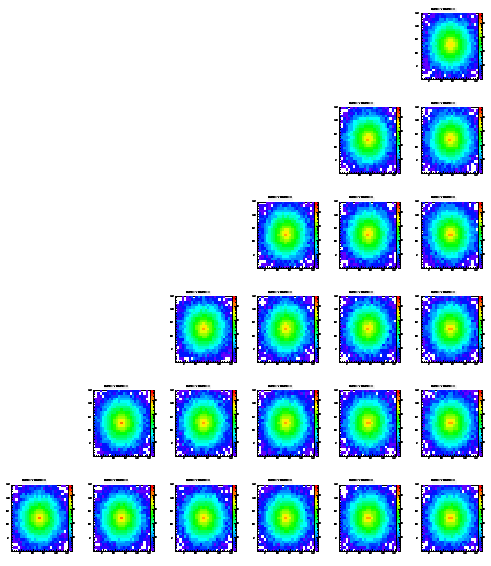
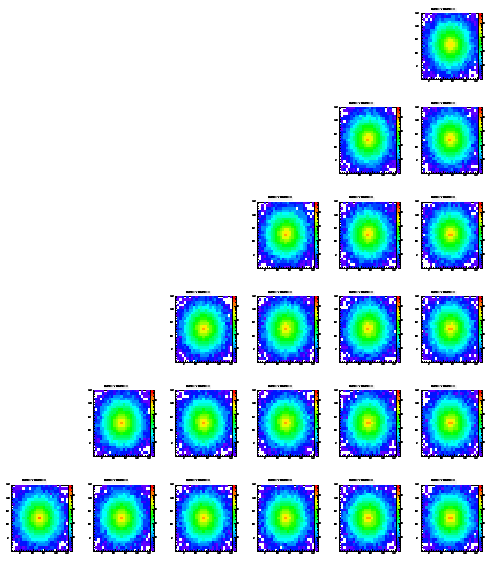
To get rid of the edge effects I repreated the same analysis/simulation with a grid of 25x25 pixels. All other settings (pixel spacing, number of events, locations of charge generation) were kept the same as for the 7x7 array.
Level 1
Level 2
Level 3
Level 4
Level 5
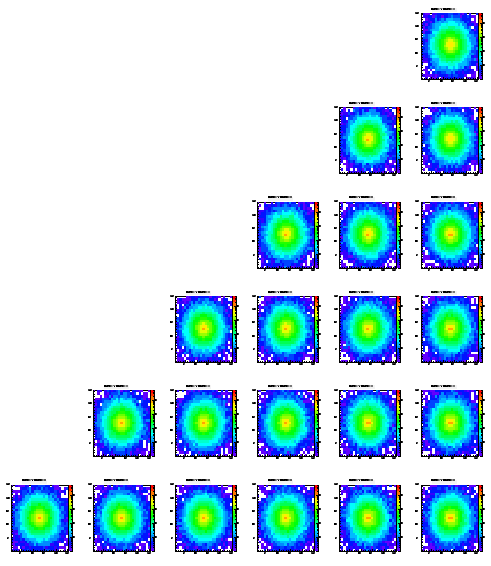
To measure the size of the peak I added the signal of the highest bins together. The next plot shows the percentage of the full signal which is collected in 1 up to all 625 bins.

The results look similar to what I got for the 7x7 array. This is an indication that edge effects don't affect this measurment too much. As before
less than 8% of all the charge is collected in the highest bin and it takes up to 7 bins to collect 30% of the generated charge. The spread of the signal is again larger than in reality. Look at Derek Shuman's results for a comparison to his finite element analysis which looks much better in this respect.
I don't understand right now, why the following plot looks so much different as the one for the 7x7 array. Something seems to be wrong here (or not, who knows - still checking). Obviously the difference measured here is much larger as before and on the average of the order of 11-12 um.
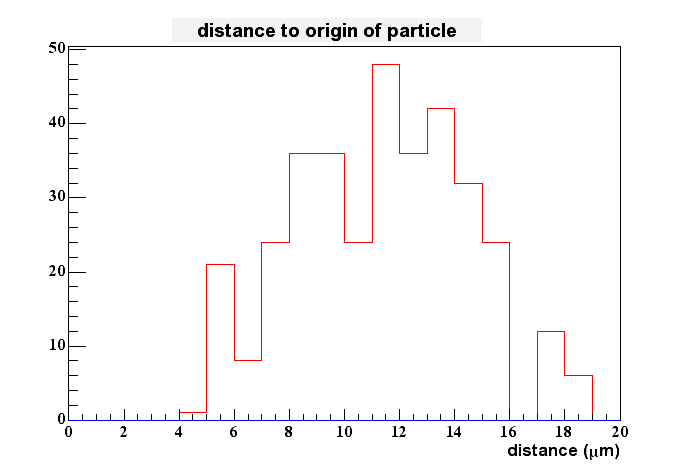
There's again no strong dependency on the signal height of the depth of charge generation, especially if you go deeper in the epi layer. But you can still distinguish the upper part from the lower one.
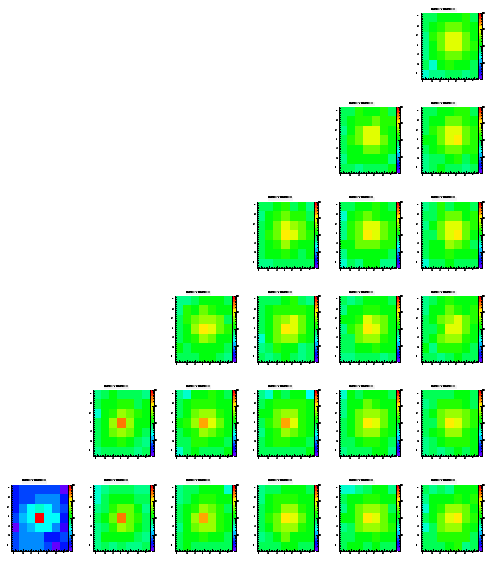
While the width of the Gaussian which was used to calculated the steps size in x, y, and z was 1 um before, it was changed to 0.1 um in this simulation. Since this calculation took much longer, the number of generated 'particles' per location of generation was reduced to 10.000. All other settings were kept the same as in the first simulation.
Level 1
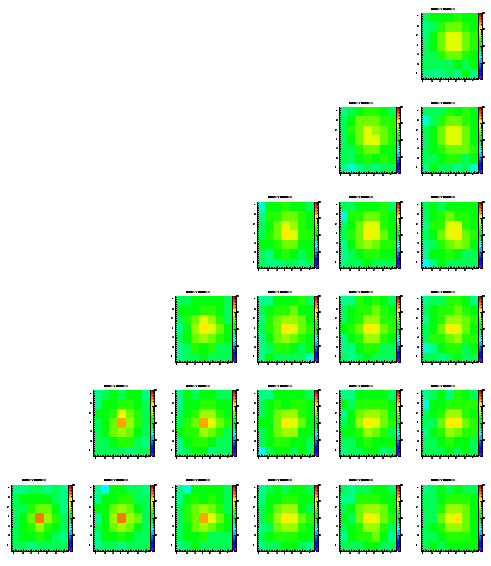
Level 2
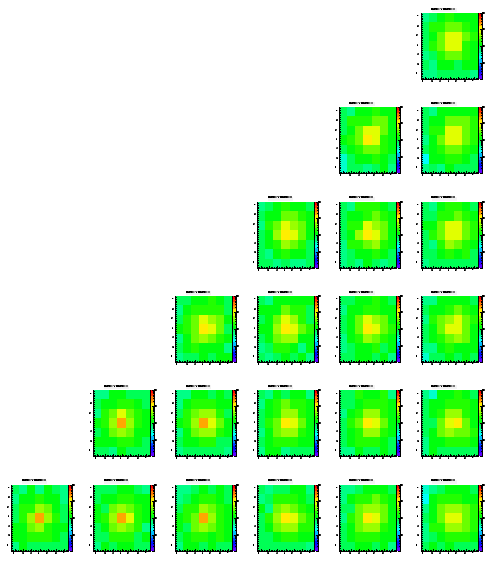
Level 3
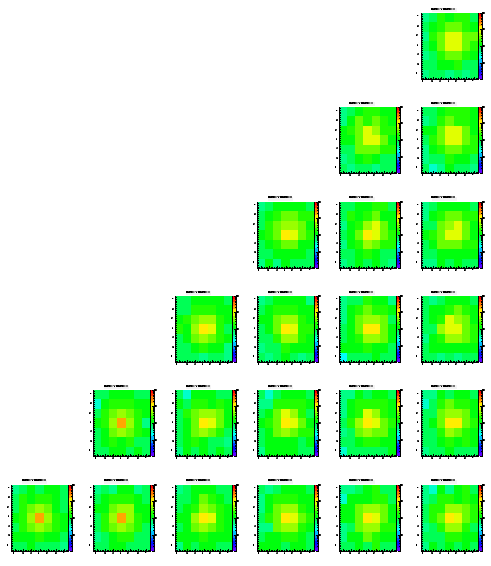
Level 4
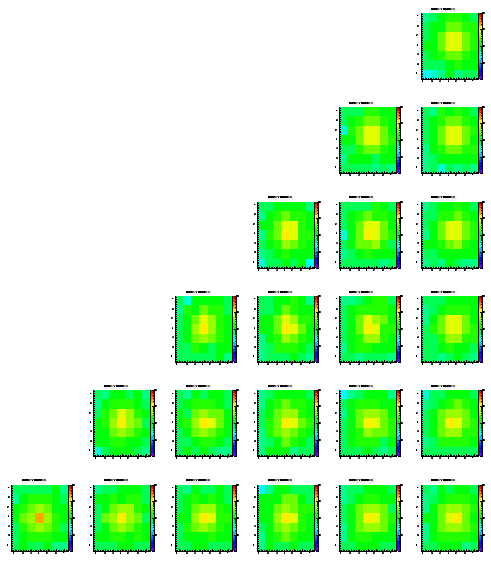
Level 5
The height of the signal is much better than for the original setting, i.e. a large fraction of the full signal is collected in the highest bins (it takes only 3-4 bins to collect ~30% of the charge). If I turn this finding around, a even smaller step size would imply a result closer to the reality. I'll check that.
I don't see a big change in this histogram compared to the former one.
The dependence of the signal height to the depth of charge generation seems to be a bit stronger than before, but it is again difficult to distinguish between different depths in the lower region of the epi layer.
While the width of the Gaussian which was used to calculated the steps size in x, y, and z was 1 um before, it was changed to 2.0 um in this simulation. This was done due to the (former and wrong) result which showed smaller peaks with smaller step size. The truth is that smaller steps show larger peaks, so we expect it to be worse here..
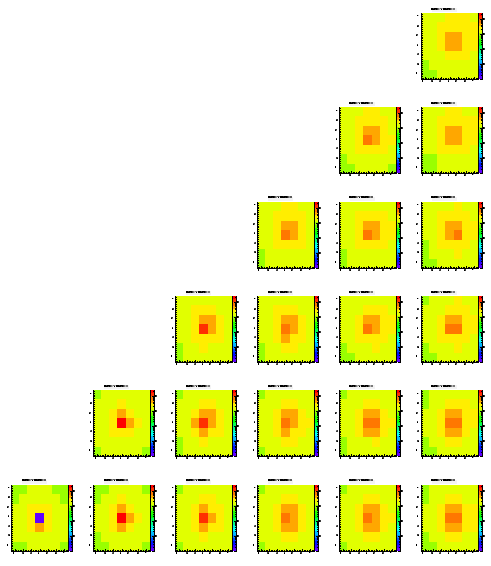
Level 1
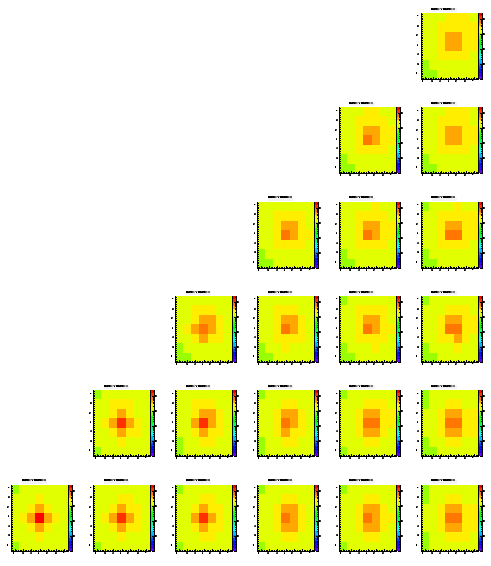
Level 2
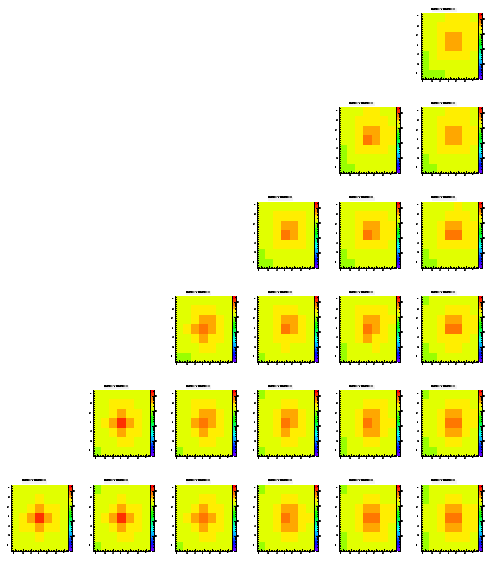
Level 3

Level 4

Level 5
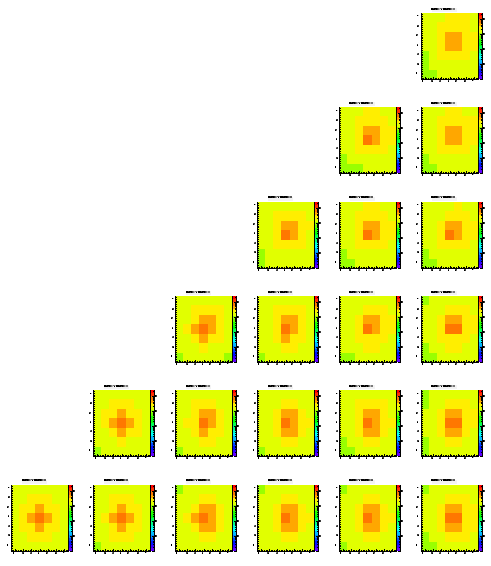
As expected (after revision of the former results) there is a smaller amount of signal in the highest bins. It takes up to 7-8 pixels to get 30% of the full signal.
No change in this histogram compared to the former one.
The dependence of the signal height to the depth of the charge generation is again present, but to get a quantitative statement is still difficult. To 'find' the upper third of the epi layer seems to be the best we can get.
In contrary to the former studies where a Gaussian probability distribution was used, for this simulation the only thing that was chosen was the direction of the next step. The step size was fixed to 1 um always. The hope was to speed up the process to save computing time. As we'll see, this method gives some funny artefacts, so I don't think I'm going to pursue this method.
Level 1
Level 2
Level 3
Level 4
Level 5
These results look similar to the ones obtained with a Gaussian random walk with a sigma of 0.1 um. The distribution doesn't look as bad as the original calculation, but the amount of signal in the highest bins is still smaller than in reality even for these simulations.
There's no visible change in this plot (actually I didn't expect one).
The following plot is screwed up, which is due to the process of evaluating the next step. The first bin (the level closest to the pixel array) has this high value since after one step in the direction parallel to the top of the epi layer the charge could still sit below thh pixel if it did so before. If the start position was in this top layer, this induces this overshoot which is very unlikely to happen if there'd be a real random behavior (all step direction possible) which is not the case here (only 6 directions to choose from). Anyhow, why the last layer (6) shows this high value is unclear to me.
The difference of this simulation to the ones shown before is that I added a depletion region of 1 um below each pixel. The effect is that a charge carrier coming closer than 1 um to a pixel in the z direction is 'sucked into the pixel'.
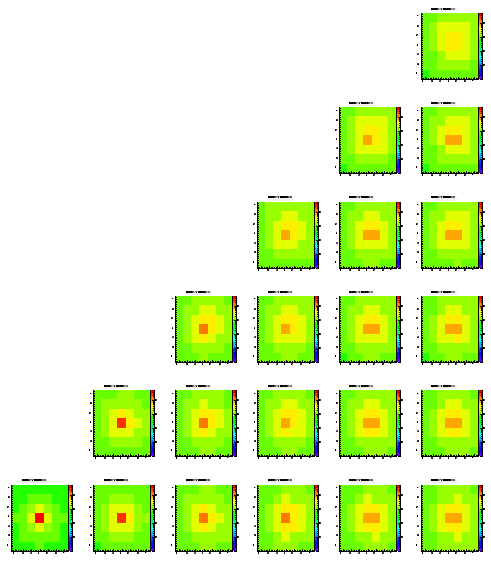
Level 1
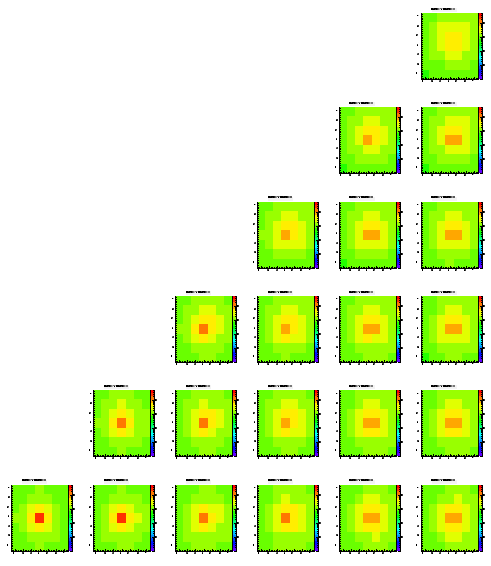
Level 2
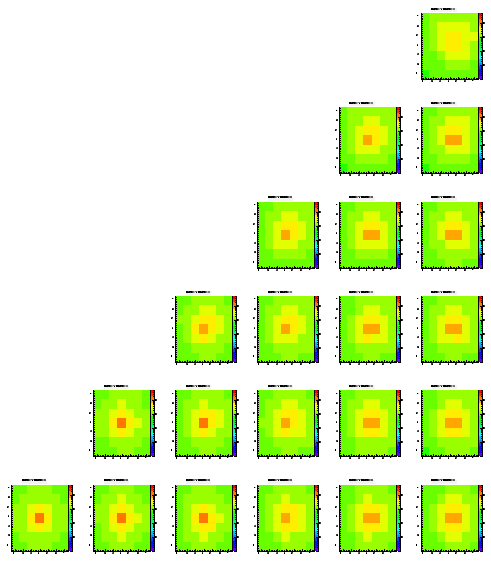
Level 3

Level 4
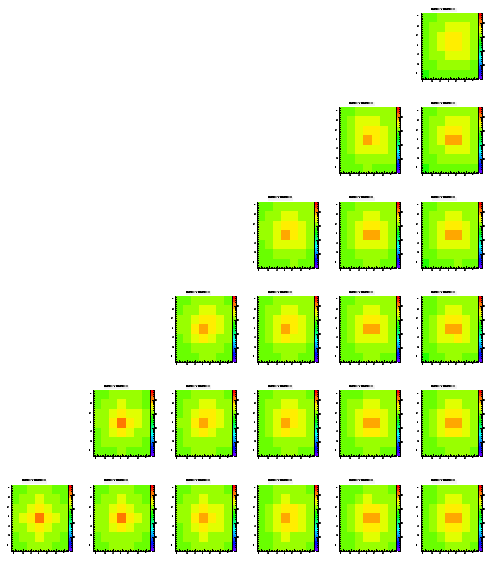
Level 5

Almost no change here. The depletion region seems to have only a very small effect on the look of this distribution.
The following plot shows the (expected) behavior, again.
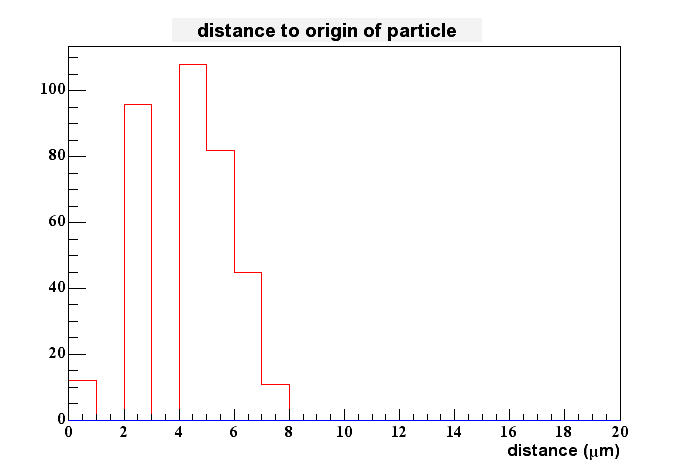
To my surprise even this plot shows no significant change compared to the original one. This makes me wonder even more since some charges are generated within the pixel already (in the top layer), but o.k. this should be a small effect (it applies only to 1/126 of all generated charges. Proper weights included the fraction is even less.
Since I could't see any clear evidence of any dependence of the change parameters so far, I changed the thickness of the epi layer to 4.5 um (half the depth of before).
Level 1
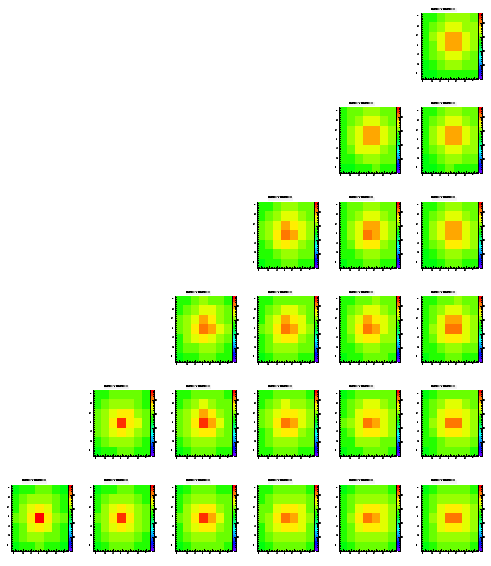
Level 2
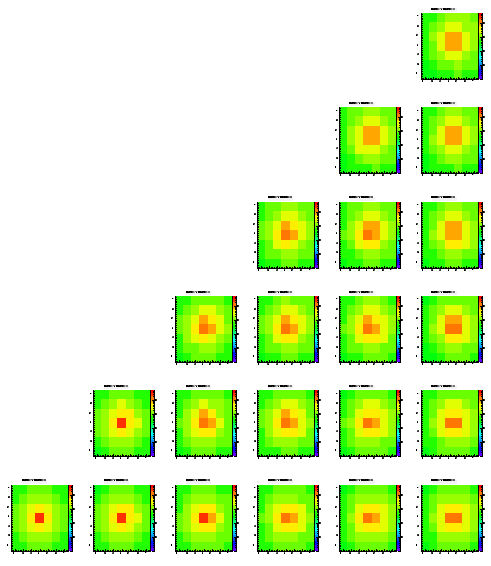
Level 3
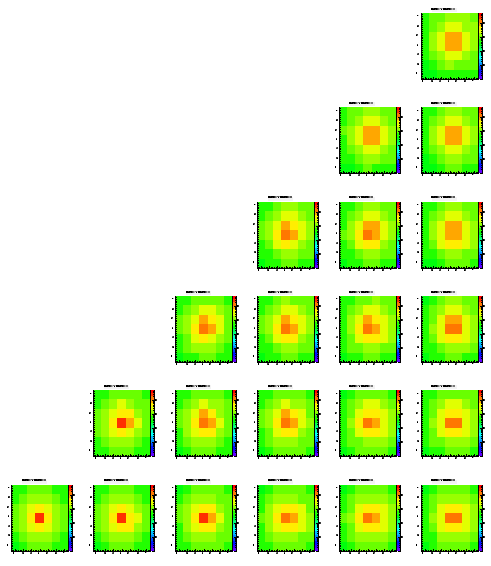
Level 4
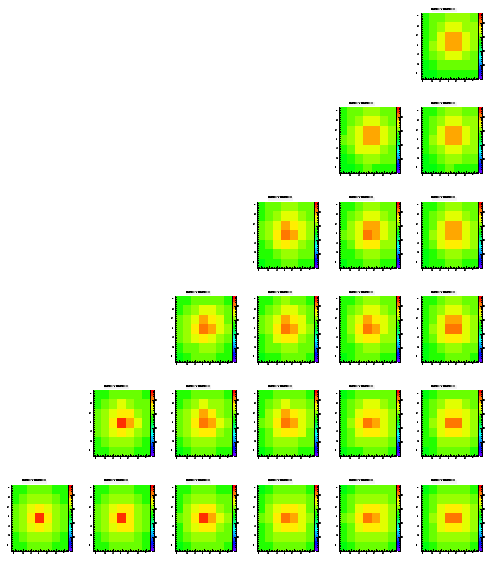
Level 5
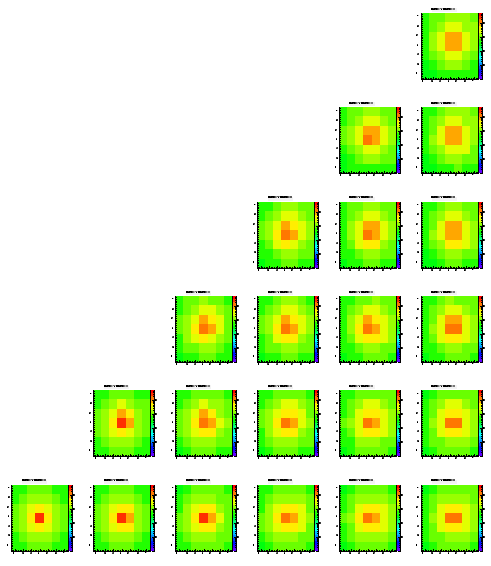
In contrary to me former statement the signal spread is somewhat better in the sense that more charge is ending up in the highest pixels. If this holds I could make the epi layer much thicker and this could solve our problem of bad agreement between these simulations and the reality. On the other hand this woudl be a non-physical solution to the problem.
Again, no change in this plot, which is good to see, anyhow.
In this thinner epi layer it is even harder to 'measure' the depth of the signal generation by looking to the peak height. This suggests that only in a very thick epi layer (with very long signal travel times and paths) it would be possible to get some good estimate of the depth of the location of the charge genereation.
My former conclusion about the effect of the depth of the epi layer mainly on the amount of charge ending up in the highest pixels was wrong, therefore I enhanced the depth of the epi layer to 18.0 um for this simulation.
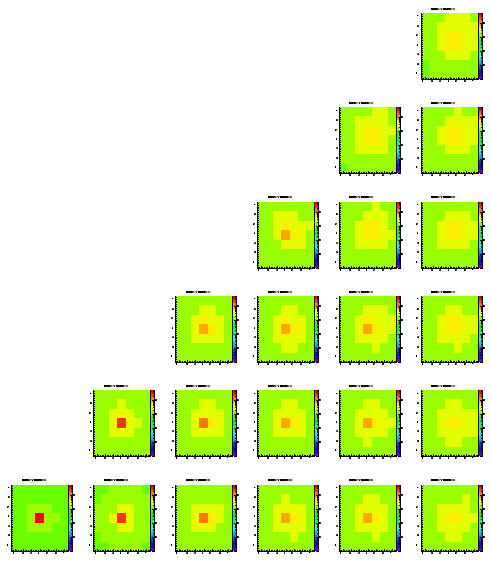
Level 1
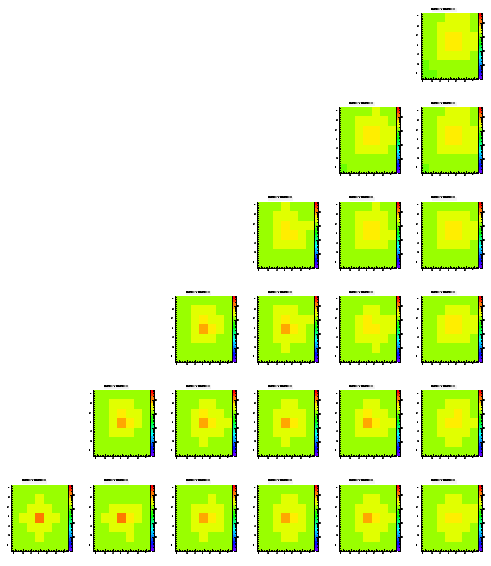
Level 2
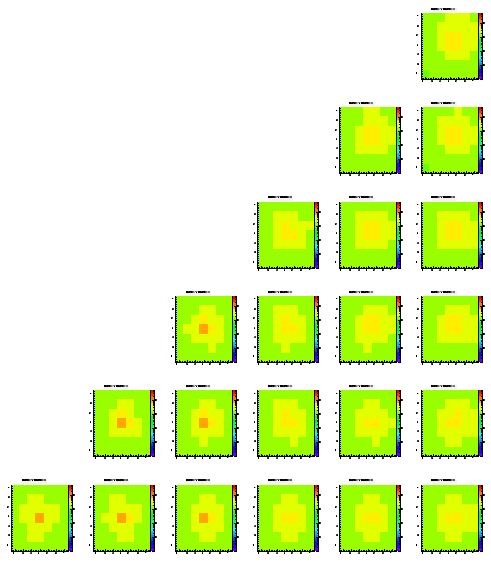
Level 3
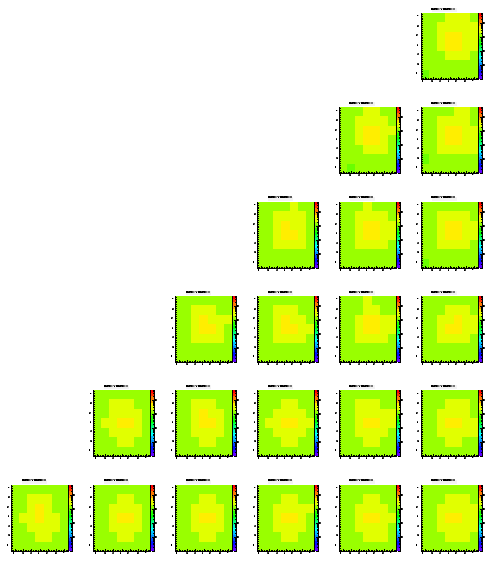
Level 4
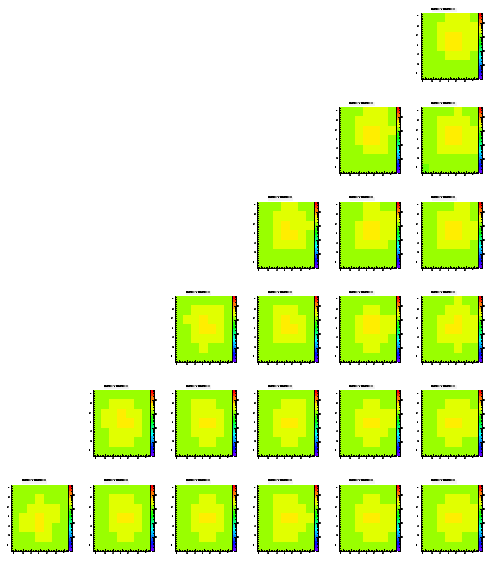
Level 5
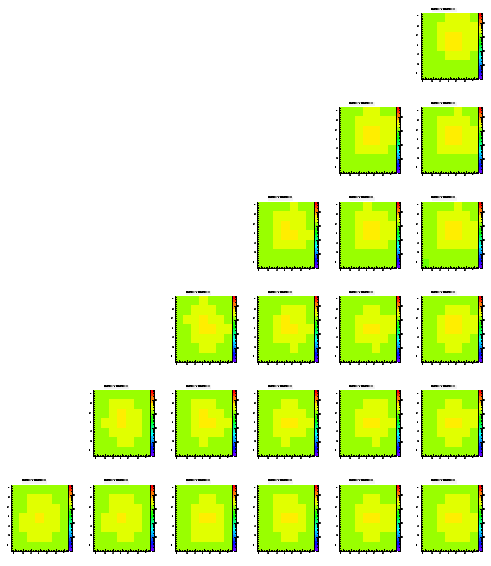
As expected (after I uncoverd my mistake) this distribution looks even worse. We need up to 9-10 pixels to collect 30% of the charge.
This plot doesn't look exactly the same as before, but the peak is at about 5 um, still - so no change here.
The larger the epi layer gets, the easier it is to measure the depth of the originating signal.
Level 1
Level 2
Level 3
Level 4
Level 5

Level 1
Level 2
Level 3
Level 4
Level 5

Level 1
Level 2
Level 3
Level 4
Level 5
Level 1
Level 2
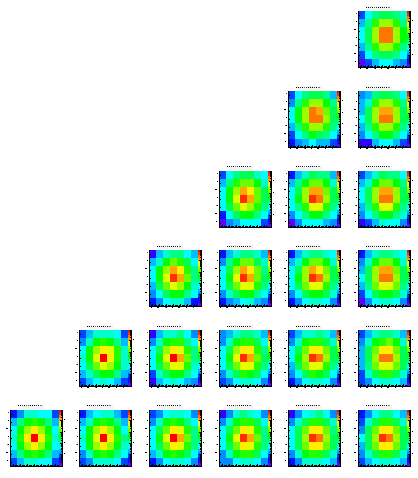
Level 3
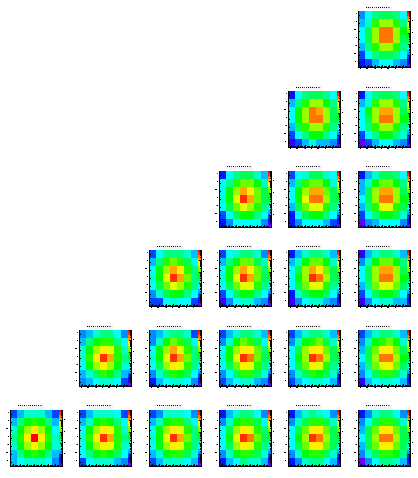
Level 4
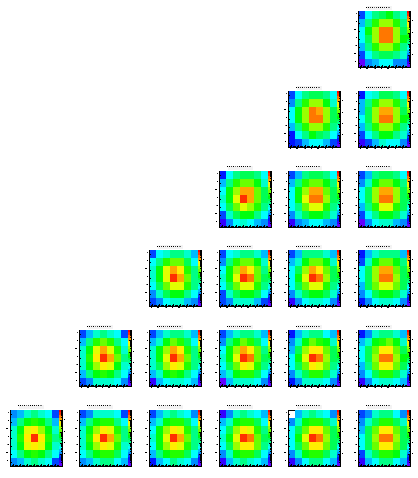
Level 5
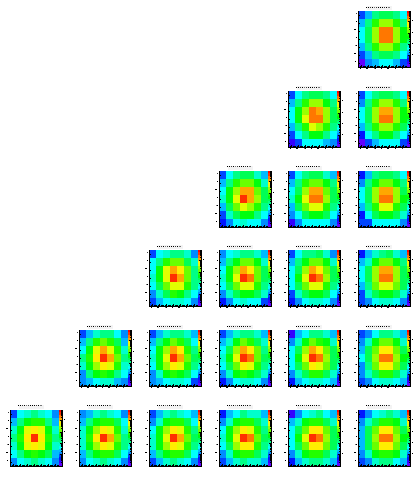
Talking to Joergen Randrup about my random walk implementation he convinced me that my approach seems to be very reasonable. But he made a simple angle argument which in my opinion shows that the percentage of the full signal in the highest pickup pixel can't be as high as seen in reality or Derek's simulation as log as we stick to our best estimation of the real geometry. (Sorry, against my former statement Derek's simulation is closer to reality than mine.)
For simplicity I'm considering a 2D simplification of you chip (pickups seperated by 20 um in x and y). If the charge is generated right in the middle of four pickups, each pickup is seen under an angle of 3.2% of 2pi. Since the radius of coverage increases with time (=steps) and the amount of particles coming back (to enter the pickup from 'behind') is to first order the same as the amount of particles turning away from the pixel again when they are approaching from the other side, this percentage should give some idea of how many of the full signal end up in the highest bin. If the charge is generated very close (but not within) the pixel, this percentage increases to 17.2%. The truth lies in between these to values and my estimate is something a bit below 10%. This is exactly what I see for my simulation.
From that I got the idea that the effective pickup size might be larger than 2x2 um^2. So I varied the pixel size from 2x2 to 10x10 um^2 in steps of 2 um in each direction. These are the results:

Comparing my results to Derek Shuman's thermal modeling I conclude that his effective pickup size is close to 6x6 um^2. Since his simulation is (for yet unknown reasons - I'm about to check his used geometry) close(r) to reality, I expect the 'real' effective pickup size to be of the same order of size.
Markus Oldenburg
Last modified: Thu Dec 4 11:58:51 PST 2003


