Plot from Hijing Monte Carlo:
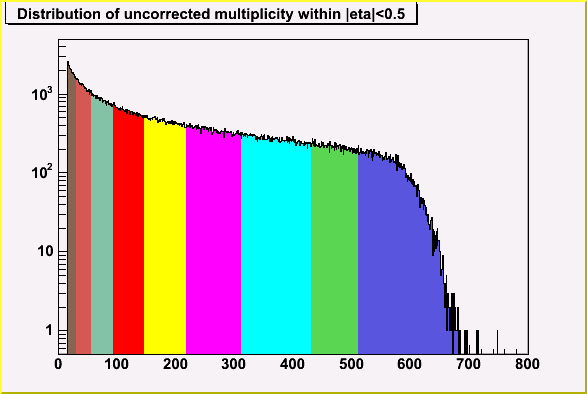
Plot from data:
This is the beginning....
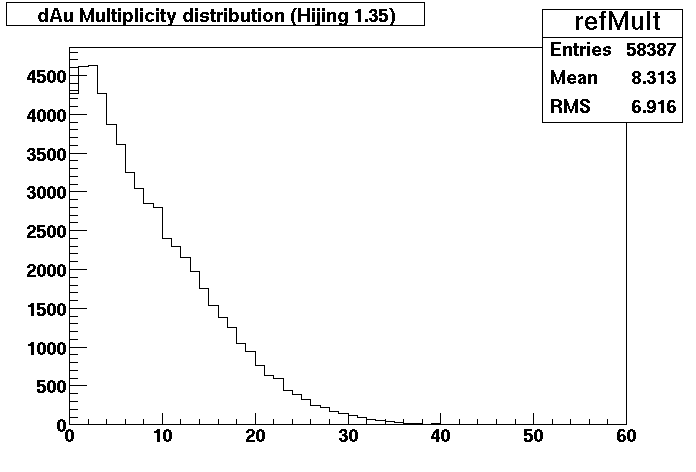
Plot from Hijing Monte Carlo: |
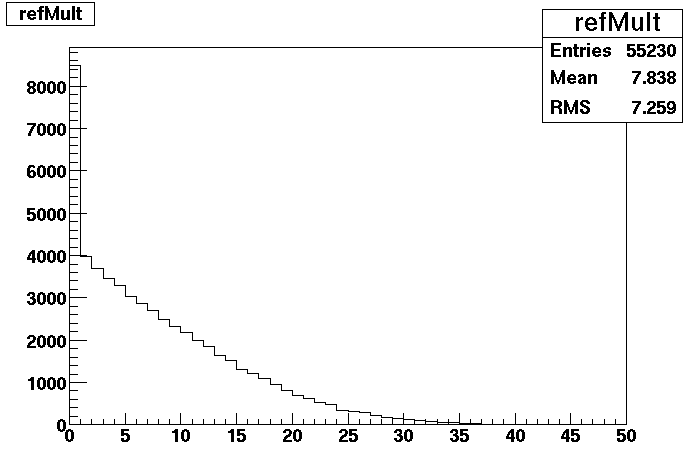
Plot from data: |
 |
 |
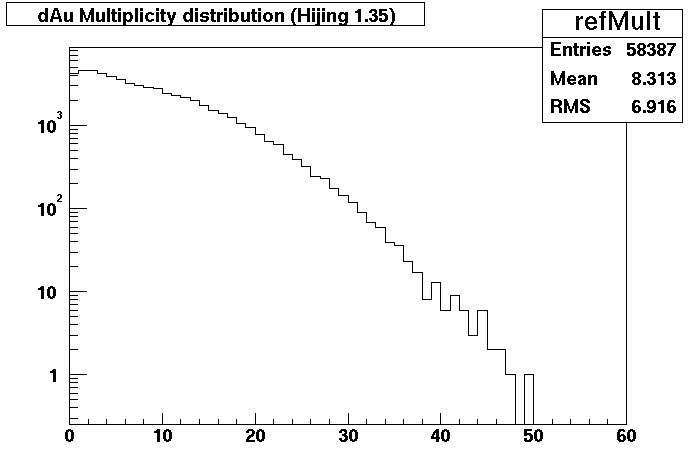
Plot from Hijing Monte Carlo (plotted with a log scale): |
Plot from data (plotted with a log scale): |
 |
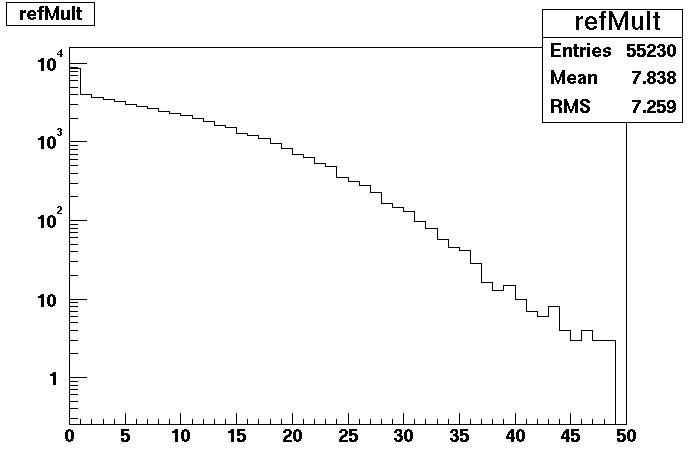 |
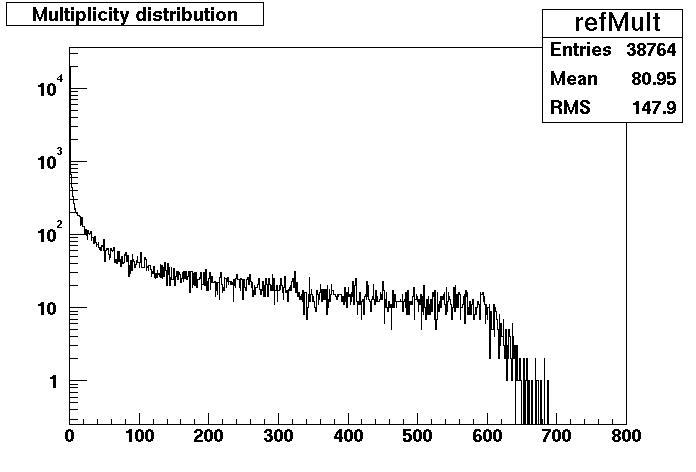
Minimum Bias Multiplicity distribution: |
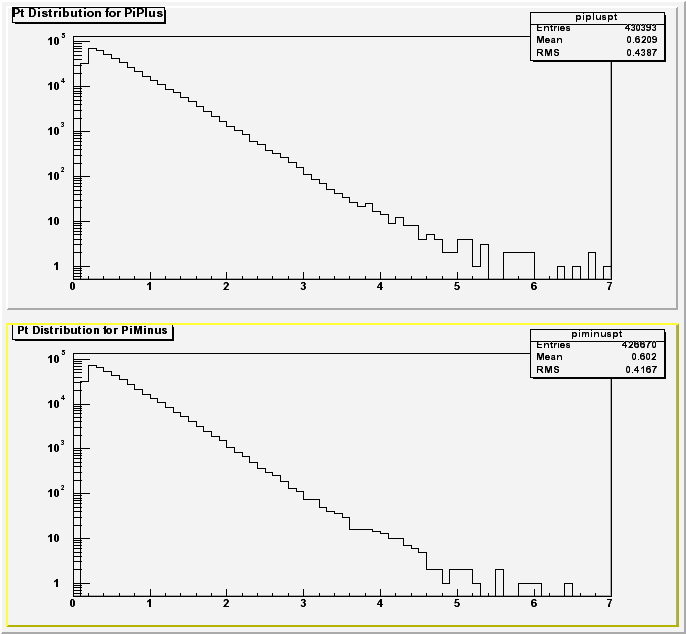
Pt Distribution for charged Pions: |
 |
 |
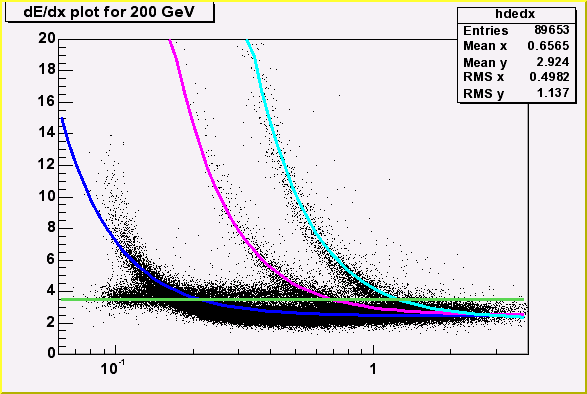
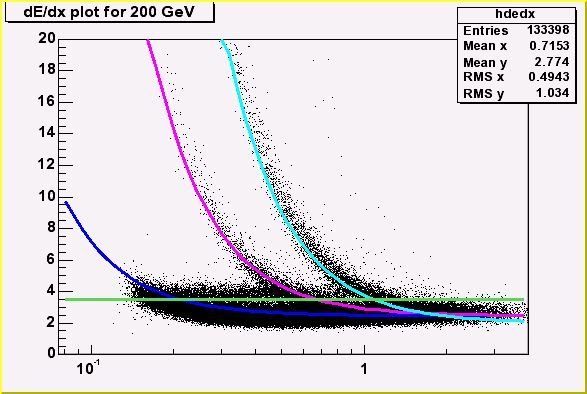
dE/dx from 200 GeV dataset (with ReversedHalfField): |
dE/dx from 200 GeV dataset (with FullField): |
 |
 |
