Abstract: The version 1.0 of the slow simulator performs
a simple energy-deposit to adc conversion for the EEMC towers
assuming ideal gains and a sampling fraction of 5%. While the
geant simulation gets the geometry of the 24 layers of the endcap
correct, it does not simulate the (measured) differences in brightness
and double readout
of the 3 special layers (pre1/pre2/post) and the other tiles.
Version 2.0 allows to change fraction of the light collected by the pre/post shower added to the reconstructed tower energy.
According to the spreadsheet, the two preshower layers provide a factor of 1.68 more light (per MIP) into the tower PMT's than all other layers. The postshower layer is actually dimmer, providing only 94% of the light of the normal layers.
The current simulator uses the following formula to compute the ADC response of each tower:
ADC = ∑ E i / 0.05 * gain
where the sum is over all layers, 0.05 is the sampling fraction and gain is the ideal gain for the tower. The simplest correction for the relative brightness of the pre/postshower layers is to weight the energy of the special layers by the relative brightness:
ADC = ∑ E i F(i) / 0.05 * gain
where the values of F(1), F(2), and F(3) are params and can be change by the set method. Defaults are set to match the bench test results. Values of F(i) = 1 for i=3..23 can't be changed.
Details of the implementation:
Slow simulator ver 2.0 takes as input the energy deposited in the tower scintillator tiles "E" (in StEvent, in MuDst just the ADC calculated by the fast simulator) and the energy deposited in the preshower and postshower scintillator layers ("E_xxx"). The fast simulator gives us 4 values:
E = E_pre1 + E_pre2 + E_layer3 + ... + E_layer23 + E_post,
E_pre1, E_pre2, and E_post.
We compute a "light yield weighted energy deposit" E', given by
E' = f * E_pre1 + g * E_pre2 + E_layer3 + ... + E_layer23 + h * E_post
with 3 weight factors f, g, h set based on the bench test mentioned earlier.
which can alternatively be written in terms of quantities we have access to from the fast simulator:
E' = E + (f-1)*E_pre1 + (g-1)*E_pre2 + (h-1)*E_post
The above correction is applied before photon statistcs is folded in to pre/post shower response.
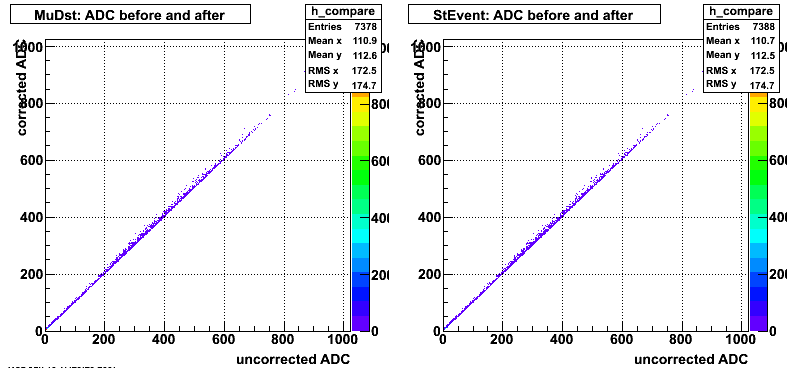
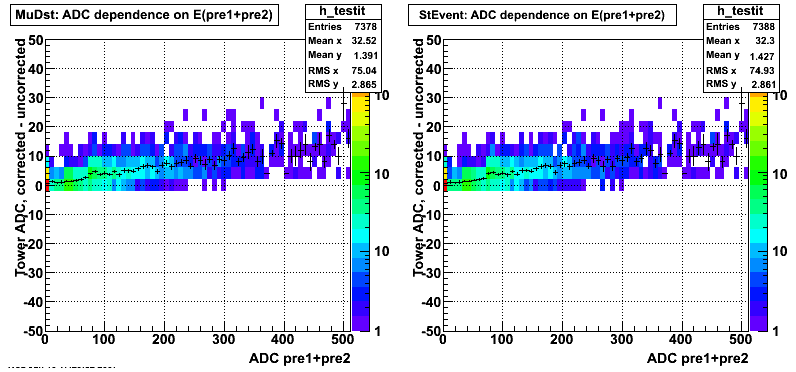
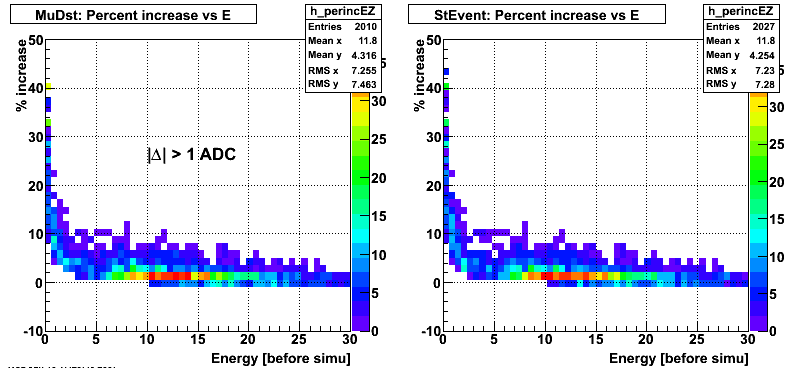
When processing events in the MuDst, we do not have access to the tower geant energy deposits for some historical reasons. This results in some roundoff errors in the MuDst which are not present in StEvent. The size of this effect is small, as shown below.
User interface:
The extra factor of (4/5) is needed to factor out the increase in light yield due to the thicker material used in pre1,pre2 and post. GEANT already takes this into account when it simulate energy deposited. The relative light yield correction in the slow simulator is only supposed to correct for the increased brightness of the scintillator.
To change pre/post light weight to other values use method:
StEEmcSlowMaker *slowSim=....
  slowSim-> setRelativeLightYield(f,g,h);
Some simple tests using the following Monte Carlo data sample.
Figure 1 -- Event by event comparison of tower ADC after slow simulator ver 2 vs. ver 1

Figure 2 -- Difference plot: difference between output and input tower ADC vs sum of pre1+pre2 ADC.

Figure 3 -- Percent increase in energy vs. original (fast simulator) energy.

Observations