 |
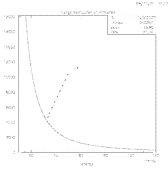
| Several Energy Distributions (E-n of Primaries) |
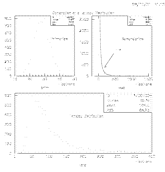 |
| Landau Distribution from Primary and Secondary Distribution |
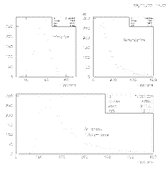 |
| Landau Distribution from Ne and Ar (from StTrsDeDx) |
|
TpcResponseSimulator |
The ionzation is taken for each detector sub-volume according to the g2t structures. The large segment is then broken up into pieces, for now constant distances, but in principle each ionization should occur according to an exponential distribution. Thus the distance between two ionzations will be given by:
where dave is the mean free path. If nave ionizating collisions occur per unit distance, the mean free path is then given by 1/nave. This gives rise to a Poissonian distribution of primary electrons per unit length characterized by a mean number.
At each interaction point a single primary electron is produced. These electrons will have an energy distribution given by the Rutherford E-2. This governs the energy for free e-e- scattering. However, strictly speaking, the electrons are not free but are attached to the atoms of the medium; in our case the TPC gas. As such the energy distribution has a medium dependence. For P10 which is mostly Ar, n=2 is a good approximation. For lighter gases, Ne requires n=2.2, and He n=2.6. This "stiffening" of the primary electron energy spectrum is a consequence of the higher binding energies of the lighter gases. It also has the desirable effect of decreasing the width of the Landau distribution as lower Z gases are used. This compensates the fact that fewer primary electrons are produced which gives rise to larger statistical uncertainty in the amount of energy spent in the ionization process. For this reason, resolution of dE/dx measurements are nearly constant, independent of the gas type used (to first order).
Th energy dependence of the primary electrons is important because those that have an energy above the ionization potential of the medium (actually above the W factor, the energy necessary to produce an e--ion pair), which are both typically 10s of eV, subsequent ionization can occur. The number of secondaries N is then given by:
where Ep is the energy of the primary electron, Ip is the ionization potential of the medium and W is the amount of energy necessary to create an e--ion pair.
The sum of the primaries and secondaries gives the total number of electrons. This effectively convolutes a Poissonian and E-n distribution which ultimately results in a Landau distribution.
|
|
|
The Charge Transporter has a single function and
that is to transport the ionization in the gas volume of the
TPC to the sense wires. In this process, however there
are three different processes that must be modeled:
It is possible to control each process independently.
The absorption of charge is a complex process that can be attributed to many different mechanisms. For our application we consider a simple parameterization where the probability for attachment to occur is given by:
P(t) = 1 - e-At
where A specifies an attachment rate given by:
A = PO2 PM CO2,M
where PO2 and PM are the partial pressures of the oxygen and TPC gas respectively. CO2,M specifies an attachment coefficient which is a function of the gas in question and the reduced electric field (E/p). For the case of STAR, a value of 10.2 us-1bar-2 has been deduced (see refs). To give an idea of the order of magnitude, for a concentration of oxygen of 50 ppm and an ionization cloud drifting for 50 us, the charge loss is expected to be 2.5%.
As the charge enters the region of the wire grids in the TPC, there is a finite transmission coefficient. Most importantly is that of the gating grid transparency---that is the probability that the drifting ionization passes through to the sense wires for amplification.
An expression for the transparency was deduced such that the full range from 0-100% transmission can be modeled. The equations require only the geometry of the readout sectors and the voltages set on the gating grid and high-voltage plane. An example of the transmission curve is shown below.
|
The Analog Signal Generator has three main functions:
Gas Gain is done by the Raether distribution or, as it is denoted in Blum and Rolandi (refs), the Yule-Furry process:
where q is the total charge in the avalanche and qave is the mean charge. Perfectly exponential behavior is seen at low to moderate gas gains, in parallel plate geometry, however at gas gains above 105, deformation from exponential shape is observed. This is probably attributable to self-saturation effects which become important because of space charge. The Raether distribution, above, is a limiting case of the Polya distribution, and may be generalized if there is need.
In TPC operation, the effect of the fluctuations are a degradation of space-point resolution. This is the physics that the implementation of the gas-gain fluctuations will attempt to address.
The signals induced on the pad plane can be calculated by solving the image charge induced on a grounded pad plane with a charge q located a distance d above it. Te solution is given by:
	                                            q d
	        sigma(x,y)  = 1/2 ----------------------------------
	                                       2           2    2 3/2
	                           Pi ((x - xo)  + (y - yo)  + d )

	  where:
           the charge q is located at a position (xo,yo) at
           a distance d above the pad-plane.
The problem for a wire chamber is to calculate the charge induced on a pad plane given a line charge situated a distance d above the pad plane but between two planes. This can be done by accounting for all higher order poles. Thus the charge density is given by:
	                        infinity       (2n + 1)   q d
	   sigma(x,y)  =  1/2      Sum   ----------------------------------
	                            n                2           2         2  2 3/2
	                                 Pi ((x - xo)  + (y - yo)  + (2n+1)  d )
Doing the sum, (and integrating over y) yields a function which describes the charge distribution induced on the pad plane at a distance x from the wire where xo is the position of the wire (and therefore the charge q):
                                             q
                   sigma(x,y) :=  -----------------------
                                            Pi (x - xo)
                                  4 d  cosh(-----------)
                                                2 d
An inverse hyperbolic cosine function of the form above is called an Endo function. The same function can be written in a form more instructive for our purposes:
	                                      2   Pi x
                                      1 - tanh  (-----)
                                                  4 d
                           F(x) := K1 ------------------------
                                              2  Pi x
                                      1 + tanh  (-----)
                                                  4 d
          where:
             K1 is a constant.
This equation, F above, can be used to generalize the Endo function in order to account for finite geometry effects of the segmented cathode with the addition of another constant K2:
	                                      2   Pi x
                                      1 - tanh  (-----)
                                                  4 d
                      Gatti(x) := K1 ------------------------
                                                 2  Pi x
                                      1 + K2 tanh  (-----)
                                                     4 d
This is the generalized solution to the distribution of charge induced on a grounded pad plane by a point/line charge. In fact it is the Gatti function that is most prevalently used for pad chamber responses. A comparison of the Gatti and Endo functions to a Gaussian (for reference) are given in the figures below.
|
We are interested in the total amount of charge induced per pad which means one must integrate these functions according to the pad dimensions. Thus for a point charge, the integral is:
	                yu   xu
	               /    /
	              |    |                       q d
	        G  =  |    |   1/2 ---------------------------------- dx dy
	              |    |                   2           2    2 3/2
	             /    /        Pi ((x - xo)  + (y - yo)  + d )
	             yl   xl
        where:
         xl and xu denote the extent of the pad in the x direction and
         yl and yu denote the same in the y direction.
The advantage of using such functions is that they
allow the production of non-Gaussian tails as seen from the
figure above. Illustrations of the function above
(which approximates the charge induced on a pad plane)
as well as the charge according to an Endo function
are shown in the following series of plots.
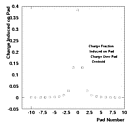
Shown at right is the distribution of charge across a pad row.
The charge is induced on a pad row for an avalanche that
develops at the centroid of the pad number zero.
The dimensions of the pad are taken to be those
in the outside of the STAR TPC super sectors
(19.5 x 6.2 mm2). The maximum charge is induced
on the central pad and falls off, slower than Gaussian, at
increasing distance from the centroid. No noise is added
here, and the 0 signal threshold is shown. Although a single
Gaussian is not able to produce the large tails, a two component
Gaussian (with two different widths) is able to do so, however
an additional free (tunable) parameter is incurred.
A generalized Gatti function (see refs) in this respect is much better, as it requires only two parameters, one of which is the pad-plane--sense-wire spacing. As such it is also being investigated because it is, in principle, the best pad response function available. It is also analytically integrable over a finite interval, unlike a Gaussian. In the final implementation, the function used to generate must be able to produce the large tails.
Once the amount and centroid of the charge distribution
on each pad is determined, the electronics sampling
can be folded. This simulates the behavior of the
switched capacitor array (SCA) in the front-end electronics.
The signals are generated by super-imposing the analog signal
from each avalanche collected on the sense wires.
This allows the shaping
time of the electronics can be varied independently of
the width of the pad response function which is not possible
in the "ALEPH" parameterization
(see refs).
Currently four types of sampling:
are being studied. The symmetric Gaussian and Endo function signals are seen in the following figures which show the time evolution of the analog signal on a single pad. A series of 20 signals are developed on a pad, and the spectrum is calculated.
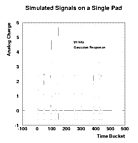
Distribution of analog charge in time bins before
digitization with no noise. The signals are taken to be
identical in pulse height and are distributed randomly
in time. The marks below the zero threshold show the
centroid position of the signal On this particular pad,
a total of 20 signals are produces and several signals
are seen to overlap.
Because the digitization is done
after the sampling is done, it is possible to combine the
signals at the analog level.

The same spectra as above with the same Gaussian response is simulated with the addition of a Gaussian noise component. The noise is simulated with a width (sigma) of 1/20 the nominal pulse height.

The relative normalization is approximately
that of the Gaussian response in the previous two figures.
Endo-like distribution of analog charge in time bins before
digitization with no noise.
An Endo-like electronics response is used to
simulate wider signals which the 1/T distribution of
an amplifier will produce. Although the pole shaping
and finite integration time in the amplifier is designed
to reduce the response at long times, it may be still
evident. In fact there is evidence for slight alterations
in the rise time of the electronics at the system test at
LBL (see refs).
Although the Endo function, which is more aptly used in
the charge induction on the pad plane, is able to simulate
a wider signal, it, like the
Gaussian response in the two figures above, still produces
a symmetric response in time. This must be addressed before
the final implementation is decided upon.
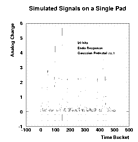
An Endo-like distribution of analog charge in
time bins, as above, is illustrated with the addition
of a simple Gaussian noise components.
These figures shows how the charge information is
combined at the analog level (i.e. before digitization)
which is very close to the physical process which occurs.
 A blowup of the region between time bin 75 and 200 is
shown in the figure to the left.
A close up of approximately 100 time bins showing
the overlap of two signals, before digitization is
shown. The main point of the figure is to illustrate that
the signals are generated by super-imposing the analog
signal
from each avalanche collected on the sense wires.
This allows the shaping
time of the electronics can be varied independently of
the width of the pad response function
There are two effects which have previously been difficult to study in the context of simulations because of the manner in which the time sampling has been implemented. Because the signal sampling is independent of any other process, any functin can, in principle, be used. This allows us to extend the sampling to an Asymmetric Gaussian. This is as simple as giving the two halves of the Gaussian different widths. Of course the constraints of the total integral of the function as well as continuity must be respected.
A comparison between the signals generated on a pad (with constant amplitude) with a symmetric Gaussian reponse with an asymmetric Gaussian response are shown in the left series of plots below. The plots include the complete series of time bins as well as a region where two pulses overlap. The width of the sampling distribution (which is fixed by the time constant of the electronics) has a dramatic effect on the way charge "leaks" into neighboring time bins.
Baseline Restoration
Because any functional shape can be specified for the response, it is also possible to parameterize an undershoot of the electronic response or an underdamping where the baseline is not restored. On the right is a single plot showing the same series of pulses as on the left, but with inadequate baseline restoration. They are exagerated to enhance the effect as there has not been evidence for significant baseline distortions unless "monster signals" are induced on the pads. It is again interesting to compare how the tails in the response affect neighboring time bins.
|
|
Chamber noise as well as electronic noise from the analog part of the electronics can be added at this point. Once this is done, the digitization can occur where a true pedestal is added and the effect of the ADC is applied to the analog charge information. Any characteristics of the digital electronics can be added and will be independent of the analog signal sampling. This is very close to the way the front-end electronics are designed where the digital and analog electronic components are separated.