General plots
|
STAR SSD |
- OFFLINE |
|
Fast Simulator plots description |
|||
|
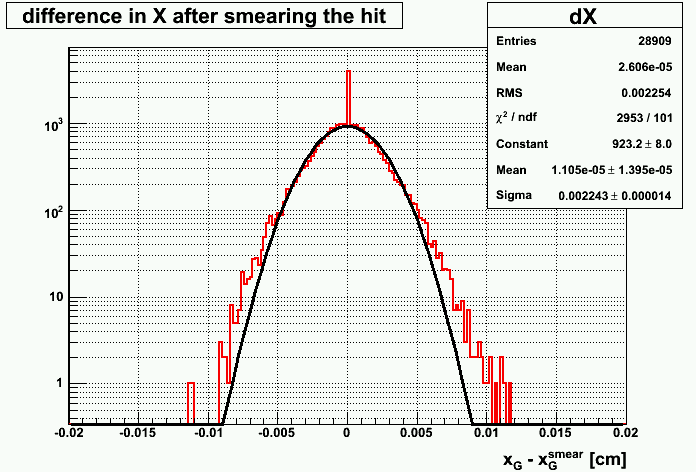
dX Distribution of the X global coordinate before and after the smearing Eplanation of the peak at 0 : here |
|
|
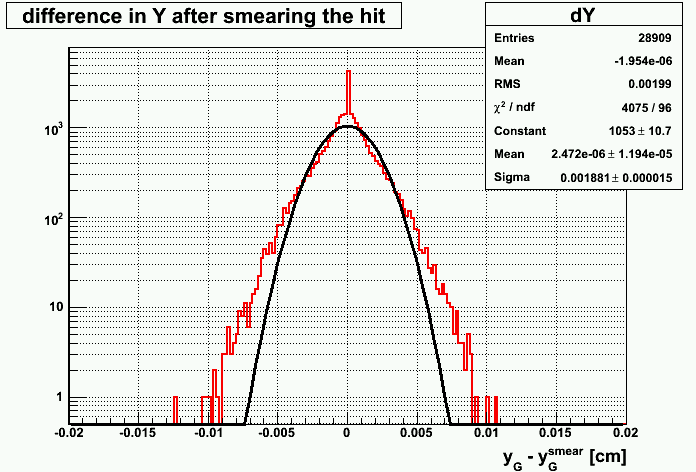
dY Distribution of the Y global coordinate before and after the smearing |
 |
|
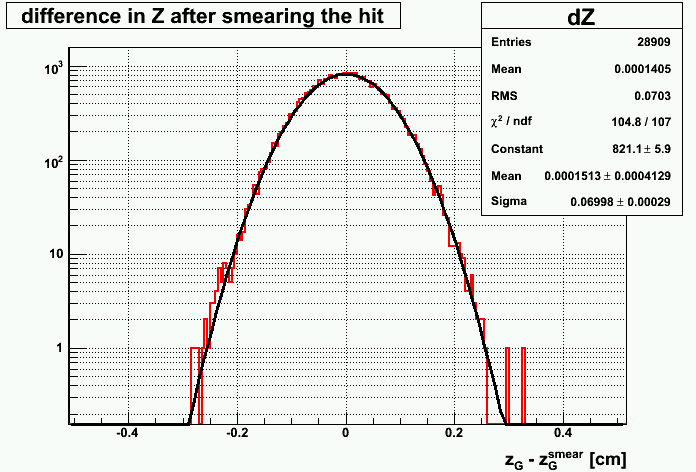
dZ Distribution of the Z global coordinate before and after the smearing |
 |
|
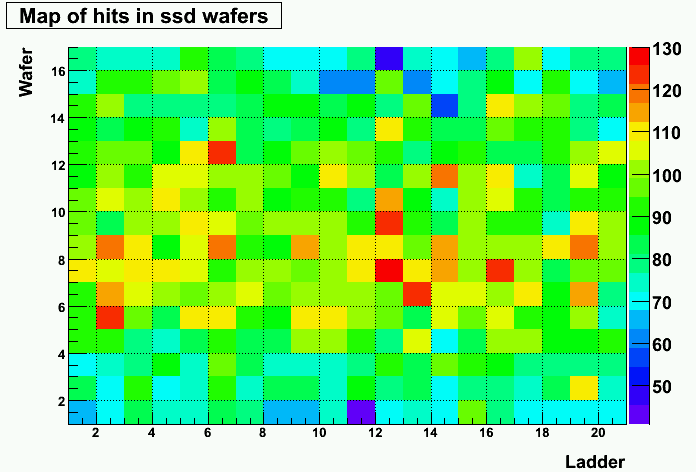
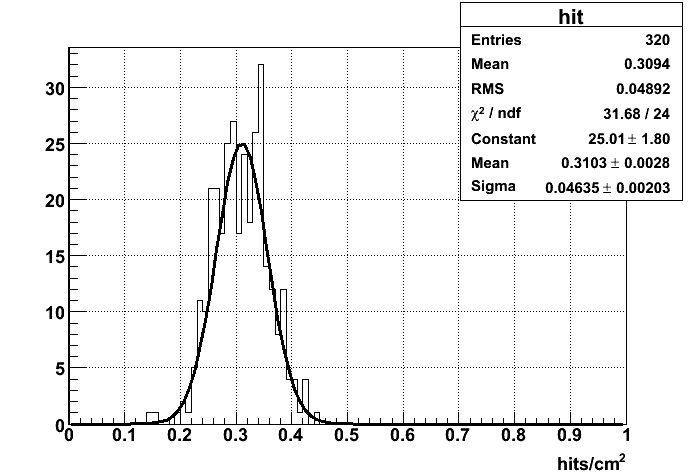
HitsMap HitsMap Distribution of the number of hits per wafer. In this example, 10 events were process ; assuming #hits/wafer ~ 10 and knowing the active area of a wafer, it leads us to a hit density : &epsilon ~ 0.30 hits /cm2 Here is a plot of the density : here |
 |
|
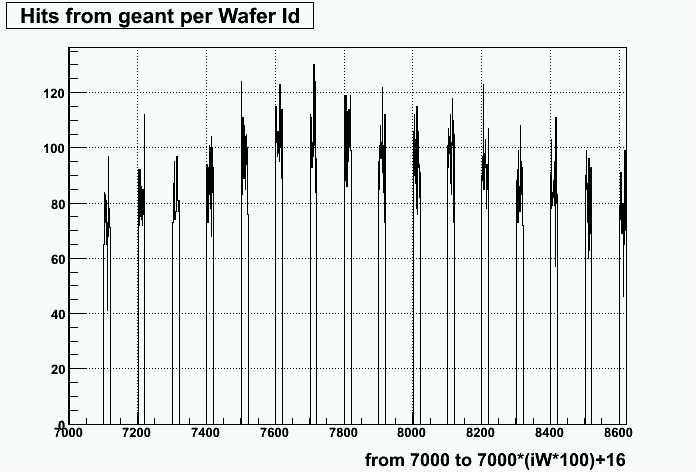
Wafer Id Wafer Id The numbering is : id_wafer = 7000 + (wafer*100) + (ladder), where wafer goes from 1 to 16 and ladder from 1 to 20. |
 |
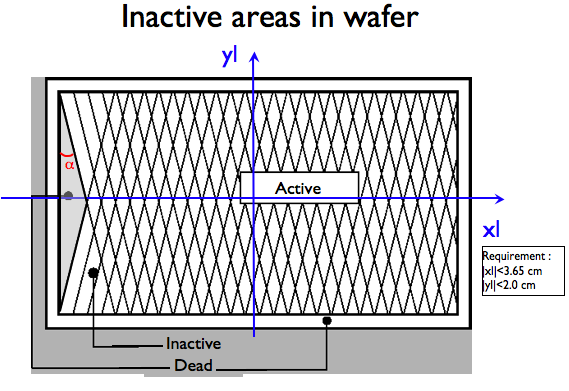 |
| Figure : ssd wafer |
 |
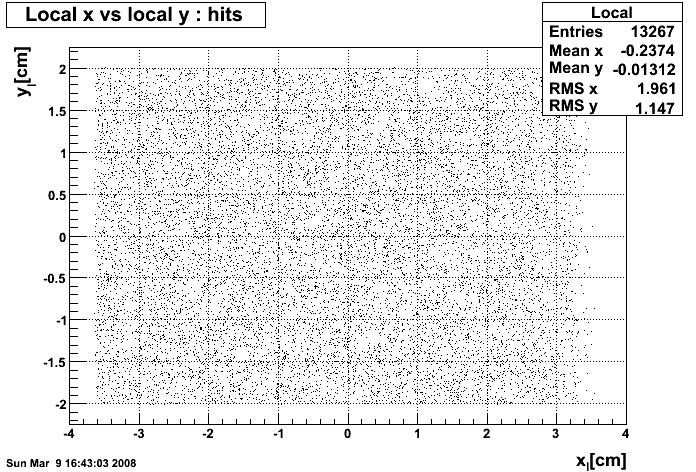 |
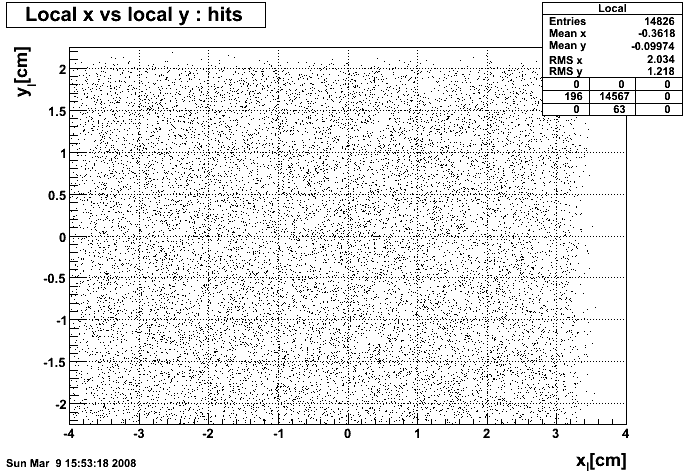
| Figure : local position of hits before the 2 methods | Figure : local position of hits after the removal of hits |
 |
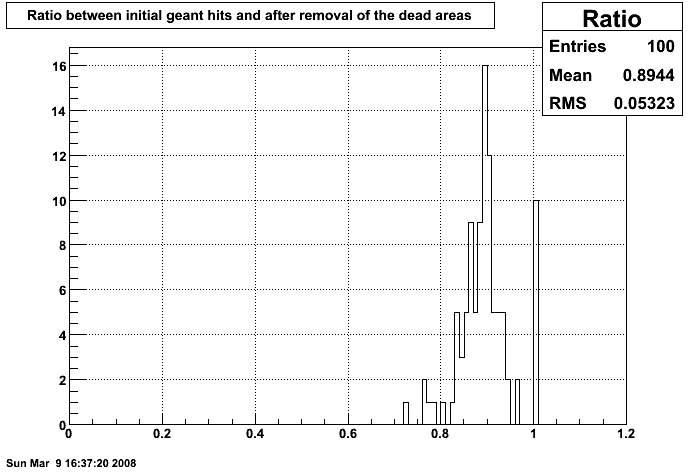 |
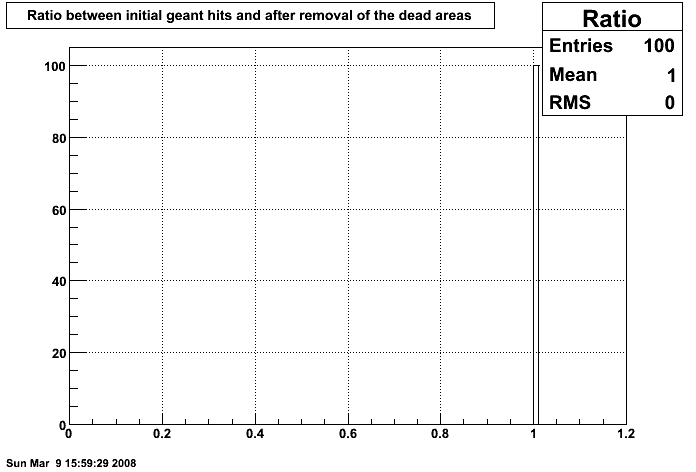
| Figure : before the 2 methods | Figure : after the removal of hits |
 |
 |
| Figure : before the 2 methods | Figure : after the removal of hits |
 Jonathan.Bouchet