Next: signals Up: MC and Data Comparison Previous: MC and Data Comparison Contents
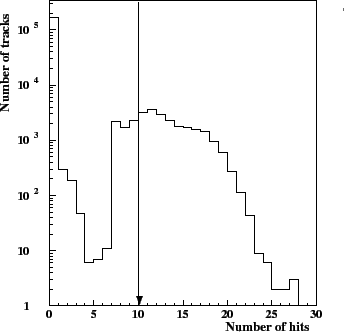
For the acceptance and stability studies a special set of tracks is used. Tracks which are reconstructed with the help of at least 10 hits found in the ITR are called tracks with significant contribution from the ITR detector. This criterion is chosen because 10 ITR hits correspond to approximately two superlayers crossed by a track. The distribution of ITR hits used for track reconstruction is shown in Fig. 6.14 left.
 |
For those tracks which fulfilled the requirement mentioned above,
the ![]() distribution for
distribution for ![]() is shown in Fig. 6.14 (right plot),
for comparison the
is shown in Fig. 6.14 (right plot),
for comparison the ![]() spectrum for
spectrum for ![]() obtained with all tracks is overlapped.
The contribution of the ITR is
mainly in the positive
obtained with all tracks is overlapped.
The contribution of the ITR is
mainly in the positive ![]() region, and the fraction of
region, and the fraction of ![]() s with large number
of ITR hits is approximately 17-18%.
s with large number
of ITR hits is approximately 17-18%.
The next important point is the performance stability check. All runs which were
proposed for the analysis were checked and
a decision about the usability was done based on the following information:
recorded module synchronization problems, power failures
and data performance plots from the off-line reconstruction DQ.
In addition the number of ![]() s reconstructed with large fraction of ITR hits
(more than 10 hits) and the number of
s reconstructed with large fraction of ITR hits
(more than 10 hits) and the number of ![]() s reconstructed with all tracks
are plotted versus time. The distribution of the number of reconstructed
s reconstructed with all tracks
are plotted versus time. The distribution of the number of reconstructed ![]() versus time obtained for one of the runs is shown in Fig. 6.15. This run
is one of the problematic runs, during it a power failure of MS13- and MS12+
happened. This failure can be seen as a drop of the number of
versus time obtained for one of the runs is shown in Fig. 6.15. This run
is one of the problematic runs, during it a power failure of MS13- and MS12+
happened. This failure can be seen as a drop of the number of ![]() reconstructed
with the help of the ITR tracks versus time at the middle plot.
reconstructed
with the help of the ITR tracks versus time at the middle plot.
Those runs which showed instabilities (like in the Fig. 6.15) are excluded from the analysis. In all other runs ITR tracks were kept in order to increase the statistics and to extend the kinematical acceptance.
Yury Gorbunov 2010-10-21