Slide
1:
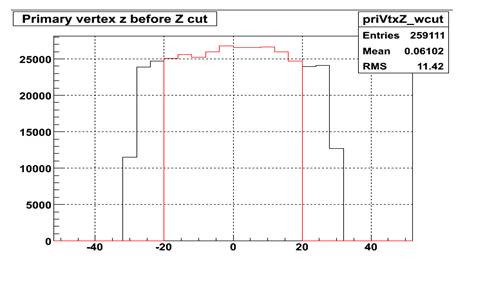
1. The
initial Z-vertex Distribution:
The z-vertex is distributed almost
flat between -32 and +32. The following plot shows the distribution before
(black) and after(red) the z-cut.
The entries before zcut = 380000
The entries after zcut = 259111
Eff = 0.6819, so we lose about
31.8% of D0s here by this cut.
Slide4
(Pt:mass Plot)
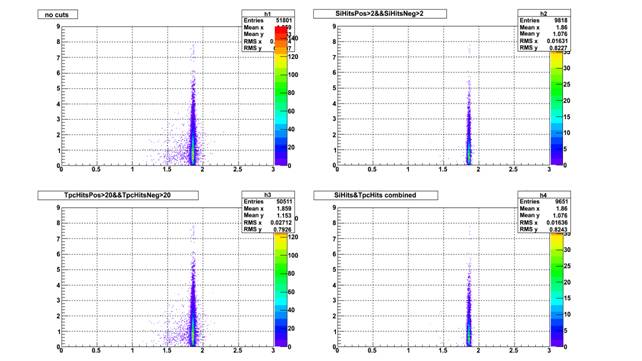
1. Efficiency
after applying cuts on Si hits and Tpc hits
|
Cuts |
No. of Entries |
Efficiency |
|
No Cuts |
51801 |
- |
|
TpcHits>20(pos&Neg) |
50511 |
97.5% |
|
SiHits>2(pos&Neg) |
9818 |
18.95% |
|
SiHits>2&&TpcHit>20(pos&Neg) |
9651 |
18.63% |
Slide5(mass
plot):
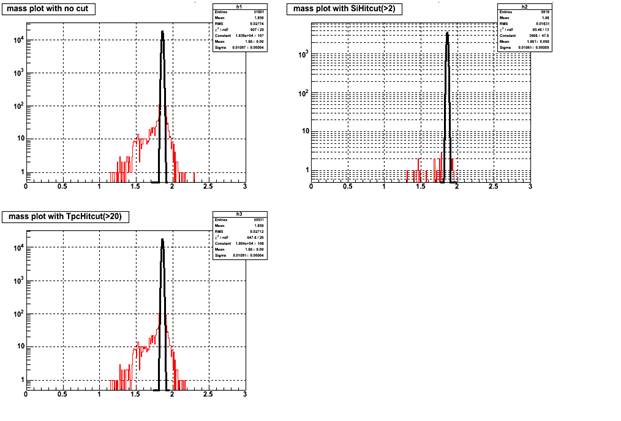
2.
mass plot with cuts on the number
of Hits in Si and Tpc:
We get a sigma of 10. 9(no cuts) to
10.66MeV(SiHits), which is consistent with what Stephen got.
Plot logY in these histos and do a
fit without the background due to wrong associations.
|
Cuts |
Chi^2/ndf |
Entries |
Efficiency |
|
No Cuts |
907/20 |
51801 |
- |
|
TpcHits>20(pos&Neg) |
847.6/20 |
50511 |
97.5% |
|
SiHits>2(pos&Neg) |
60.46/13 |
9818 |
18.95% |
By
eliminating the background the Chi^2 reduces from 1260/85(too high) to 907/20 in the no cut case.
Slide
6(mass plot with eta cut):
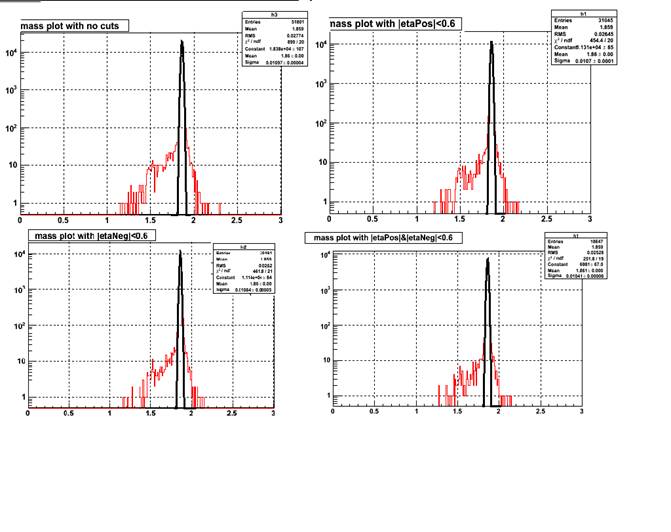
3.
Efficiency after cutting on the eta of
daughters.
|
Cuts |
Entries |
Efficiency |
|
No Cuts |
51801 |
- |
|
|EtaPos| < 0.6 |
31045 |
59.93 |
|
|EtaNeg| < 0.6 |
30461 |
58.80 |
|
|EtaPos|<0.6&|EtaNeg|<0.6 |
18647 |
36% |
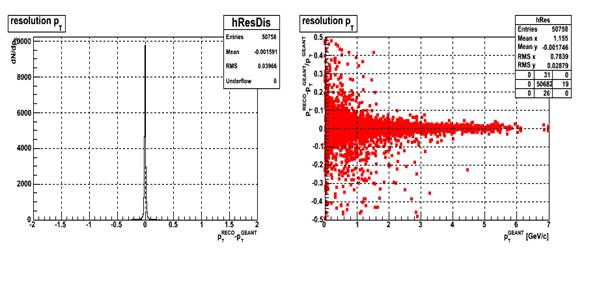
Slide 7(pT Resolution):
4. A
slope of 3MeV is expected for the mean (pTRECO – pTGEANT).
5. Do
we apply any correction to the dEdX of K and pi? – Not yet.
mean(pTRECO
– pTGEANT)
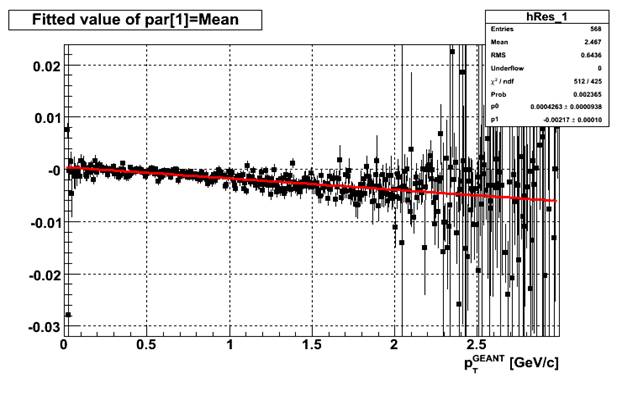
A slope of 3MeV is expected due to the
decreasing D0 mass with pT increase. Here the slope is 2.17+-0.1MeV, which is
in agreement with the above.
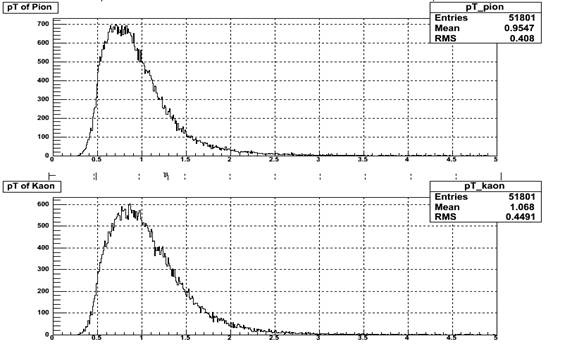
Plot
the mean pT of the daughters:
Mean pT of daughters:
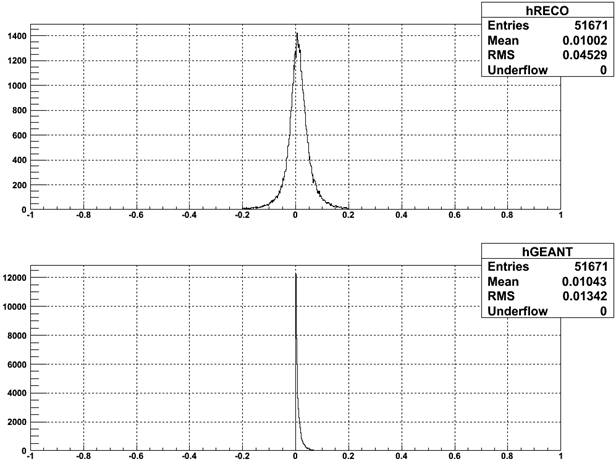
Slide 8(sigma = σ(pTRECO –
pTGEANT/pTGEANT) )
6. Plot the sigma , σ(pTRECO –
pTGEANT/pTGEANT)
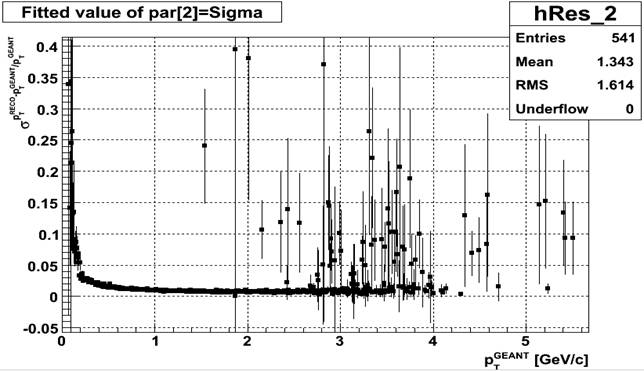
For
sigma single track resolution is not expected.
Slide10:
7. Lots
of decay lengths with negative values for the RECO( probably due to resolution
of the Si detectors )
Later works on decay Length Resolution can be found
on this page