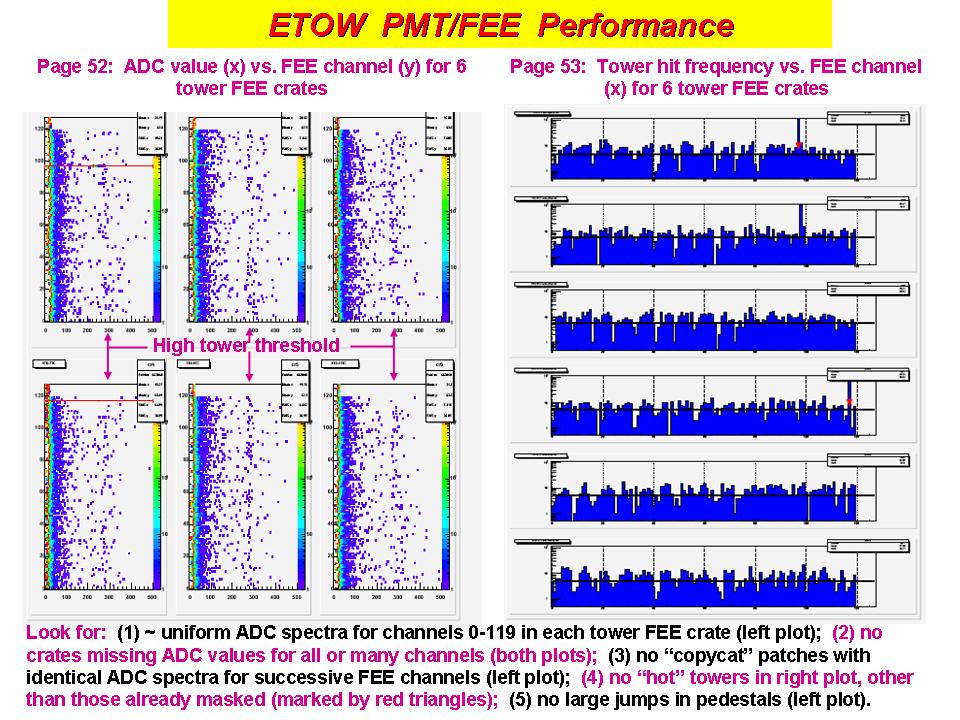
| Here are the QA plots for the TOWERS. Raw spectra at left and high tower spectra at right. (Click here for larger image) |
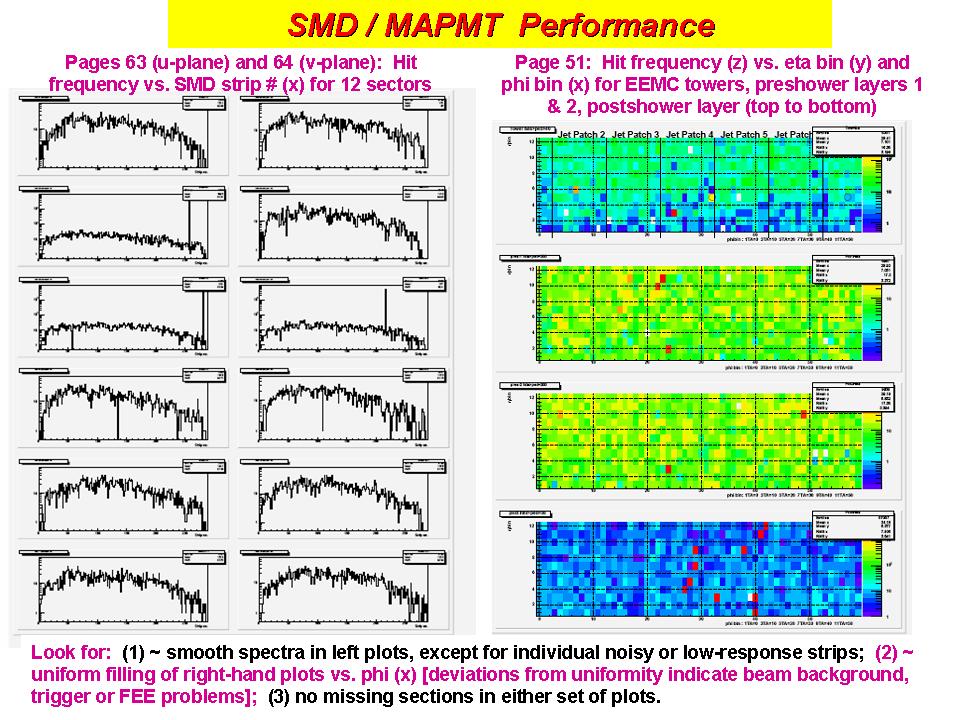
| QA plots for the MAPMT FEE (e.g., SMD and Pre/Post-Shower Detectors (Click here for larger image) |

| Trigger: arranged by trigger patch (TP) and jet patch (JP). High tower response at left and patch response at right (Click here for larger image) |
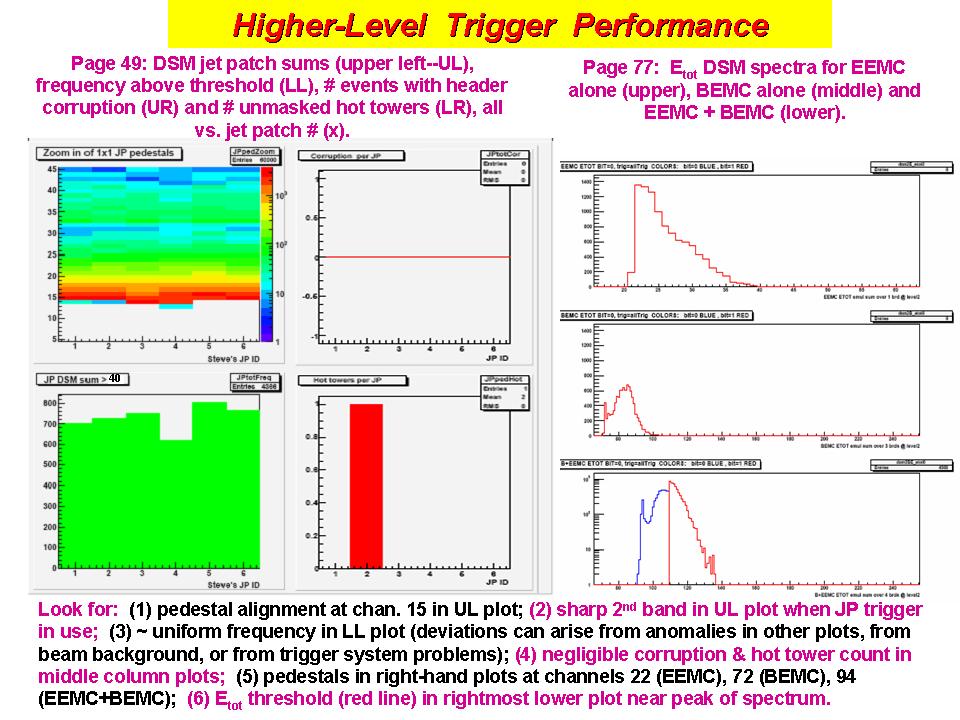
| High Level Trigger Performance (Click here for larger image) Note: total energy EMC plots at right were used only for run 6 |
Archived EEMC (Panitkin) QA Plots
Older write-ups .. operation updates (esp. trigger) may make
some plots obsolete.