Calibration of EEMC Towers using pi0 --> gamma gamma
Analysis Details
- Two cluster invariant mass spectra for were accumulated for the most energetic seed tower in each event.
- All cluster pairs which contained the high tower in the event were studied.
- EHT1 triggers were used for calibration. EHT1, EHT2 and MINBIAS triggers were separately binned.
- For EHT1 and EHT2 events, pi0's with less than 4.0 GeV energy were discarded to reduce background of "untriggered" pions.
- 25 background events were mixed for each real event.
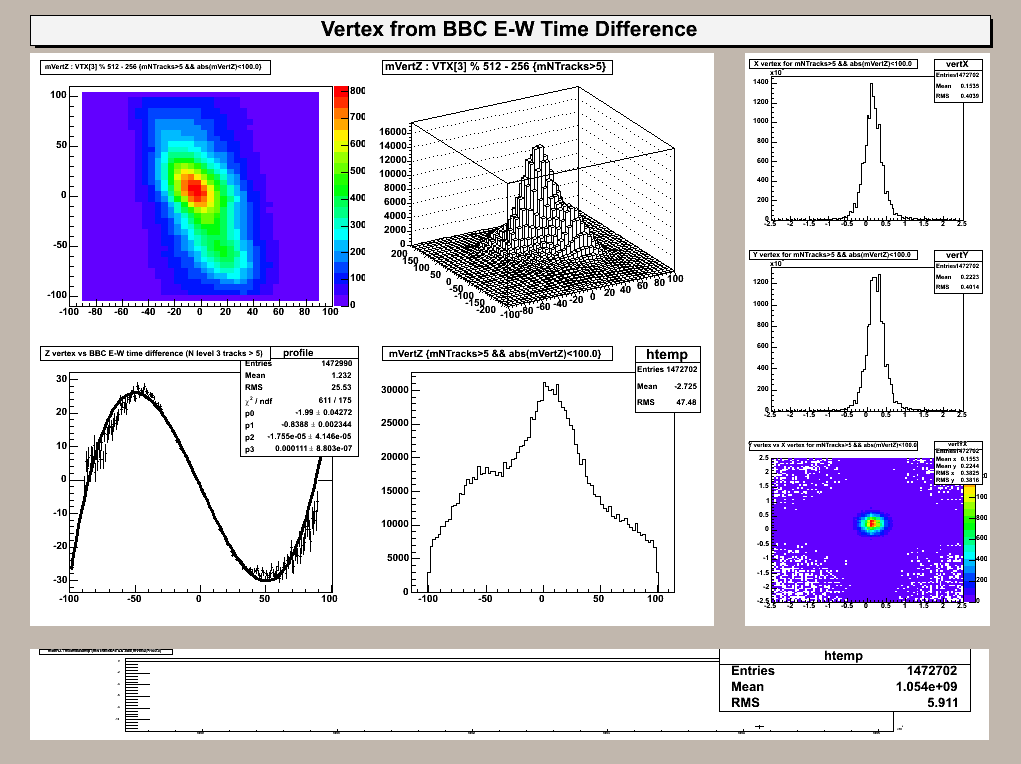
- An approximate Z vertex was determined from BBC E-W timing information.
- The Monte Carlo was used to correct for systematic effects in the mass of the neutral pions due to the poor granularity of the detector coupled to the highly asymmetric decays.
- Monoenergetic pions were generated at 2, 4, 6 and 8 GeV.
- Invariant masses were fit in each eta bin.
- The mean energy of the background-subtracted pions in the data was used to interpolate between the different expected Monte Carlo pi0 masses.

Overview
For EHT1 events which contain two or more clusters we calculated
the invariant mass of the two clusters. The mass was binned in
histograms corresponding to the tower which fired the high-tower
trigger (assumed to be the most energetic tower in the event, and
required to be > 4.0 GeV). The combinatoric background was
calculated by mixing uncorrelated clusters randomly selected from
previous events with one of the two clusters from the real event.
The background-subtracted mass spectra in each tower/eta bin were
then fit with gaussians to determine the pi0 mass. These were
then compared with the Monte Carlo predictions for each eta bin
to extract a gain correction:
	  h = M2 / Mpi2= 4 E1E2 sin phi / 2 / Mpi2


	  h = gcorrected / g
Iterated gain corrections
First iteration set439e
was based on an initial set of calibrations, i.e. Piotr's MIP analysis a.k.a. set430.
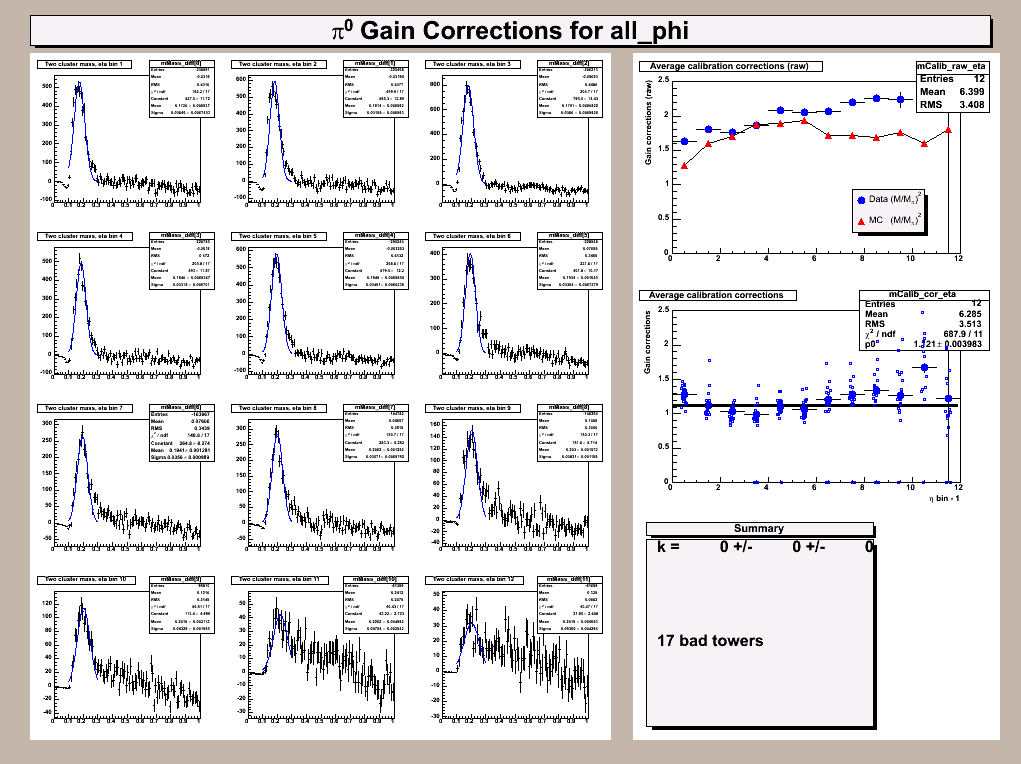
The plot shows the mass spectra accumulated in each eta bin, the
raw gain corrections for each eta bin (top right) and the
monte-carlo adjusted gain corrections for each eta bin (center right).
The smaller data points in the center-right plots show the
gain corrections for each tower, extracted from tower-by-tower
fits which can be found in this directory.
Subsector 5A seems to have the best statistics of any of the
plots, subsector 7E is one of the worst.
The gain corrections were applied to obtain a calibration which
I called set439e. The pi0 finder was run a second time to
obtain set439f,
with individual tower fits in this directory.
At some point in all of this, I decided that we lacked statistics
to make definitive statements about eta bins 11 and 12 (near eta = 1).
I attempted to filter these towers out of
set439g
(tower fits) so as not to introduce systematic
uncertainties in the bins at larger eta.
Set set439h
(tower fits) is about the best we can do for
eta bins #1-8, I think. The poor-quality of the fits available
in eta bins (10), 11 and 12 couple into bins (7), 8 and 9, increasing
systematic uncertainties in those bins.
On the next iteration, I attempted to merge set439h with the MIPS,
and include eta bins 11 and 12 in the analysis again.
set439i
was the result (tower fits). One more iteration
was attempted to try to retrieve any information near eta = 1.0,
fixing eta bins 1-8 to the set439h values. This resulted in
set439j
(tower fits). I think we've found the
point of diminishing returns.
Systematic uncertainties
- Estimate 3% from uncertainties in the fits
- Estimate 5% from uncertainty in Monte Carlo correction, by looking at the pi0 masses from the MINBIAS data using calibration set 439h
minbias calibration estimate
Note from the minbias systematic uncertainty plot, it is clear
that the EHT1 data gets the normalization wrong by on the order
of 15-20%.
.
Older stuff below saved for my reference... please ignore
Gain Corrections
Below you will see the "standard" set of gain correction plots
using pi0's. Invariant mass spectra are shown in each eta bin
on the left. On the right, the extracted gain corrections ("h"
in the above equations) are shown. The top plot shows the gain
raw gain corrections in each eta bin from the data, and the
expected result from the Monte Carlo.
The plot below this shows the ratio of the data to Monte Carlo
corrections, i.e. the correction to the gains which we should
apply to the data to reconstruct the "expected" (from Monte Carlo)
mass of the pi0 in each eta bin. The smaller open square data
points show the results individually for each tower.
The eta bin fit results in a calibration constant "k" equal to--
k = sqrt(1.12055) * 50 ch/GeV = (52.9 +/- 0.2 stat +/- 5.3 syst) ch/GeV.

Plots of the fits and corrections for each tower are available
below. Again, the "standard" set of calibration plots are shown
for each subsector -- fit mass spectra, raw data and Monte Carlo
corrections and final corrections for each tower.
"Proposed" gains from pi0's are also shown. Where the pi0 analysis
has obvious problems, the old calibration is left in place.
For larger eta bins, we also leave the calibration alone, since
resolution and background becomes questionable.
Jason C. Webb
Last modified: Wed Sep 10 09:43:49 EDT 2003

