General plots
|
STAR SSD |
- OFFLINE |
|
OfflineQA plots description |
|||
|
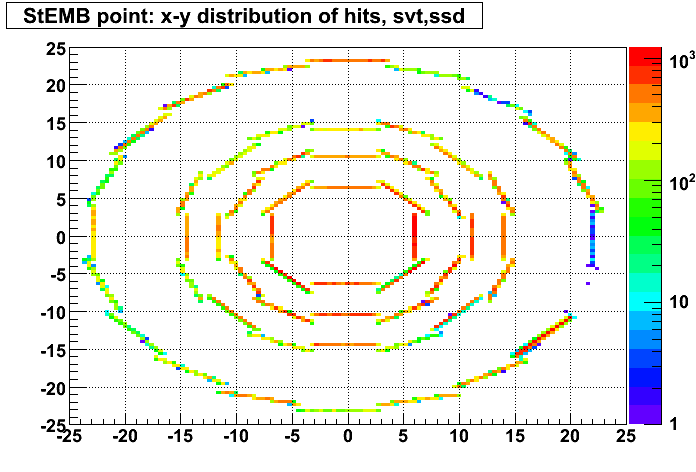
StE*QAPointXYSvt Distribution of SSD hits in transverse plan The SSD layer take places at a radius ~ 23 cm. |
|
|
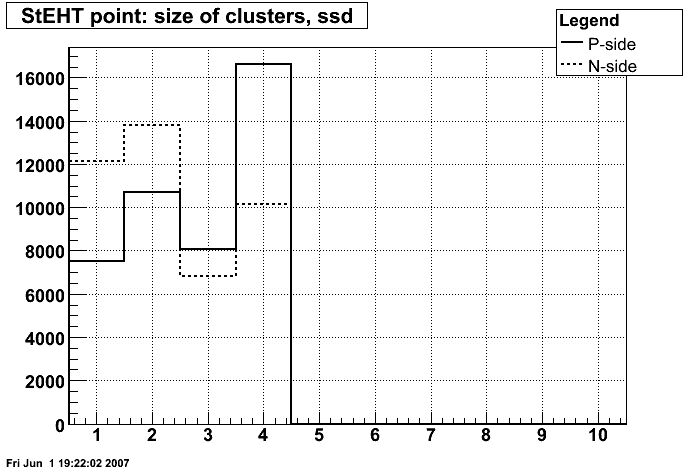
StE*QAPointSizeSSD Size of clusters The size is in number of strips. We write only the size up to 4 strips so the last bin (size = 4 strips) may contain clusters which size is higher than 4. |
|
|
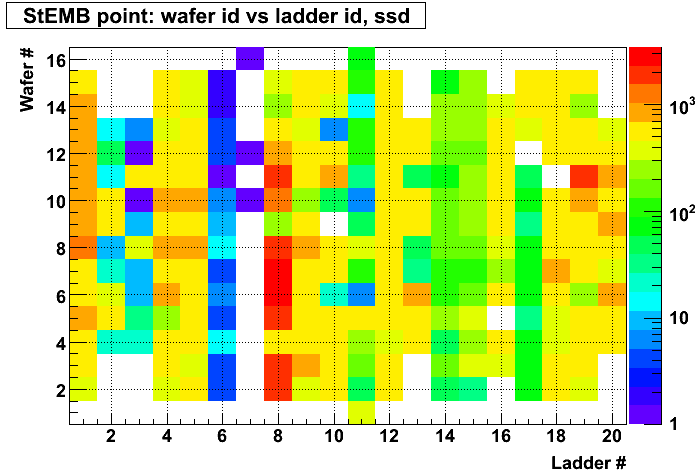
StE*QAPointLWSSD Number of reconstructed hits in each wafer The x-axis represents the ladder Id ; the y-axis the wafer Id. |
|
|
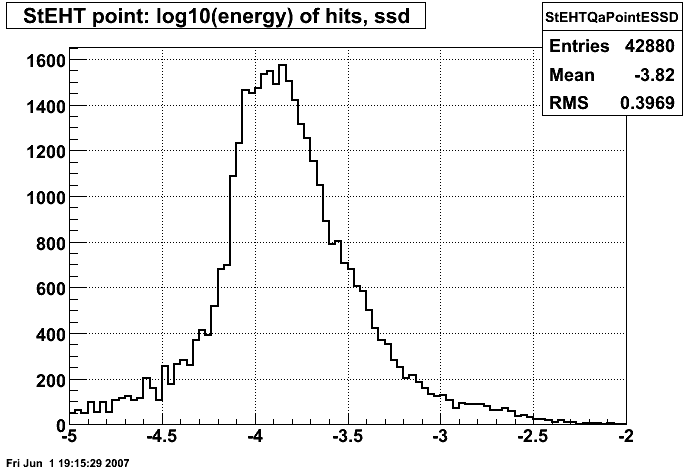
StE*QaPointESSD Energy Loss It represents the energy of reconstructed hits in GeV (here plotted as log10) for MIP's one expect a energy deposit of 110 keV in 300 &mu m of silicon. |
|
|
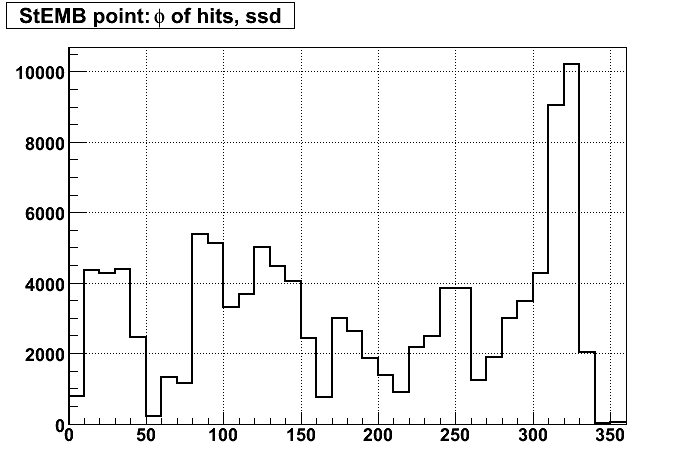
StE*QaPointPhiSSD &phi Distribution of hits It represents the &phi distribution of hits |
|
|
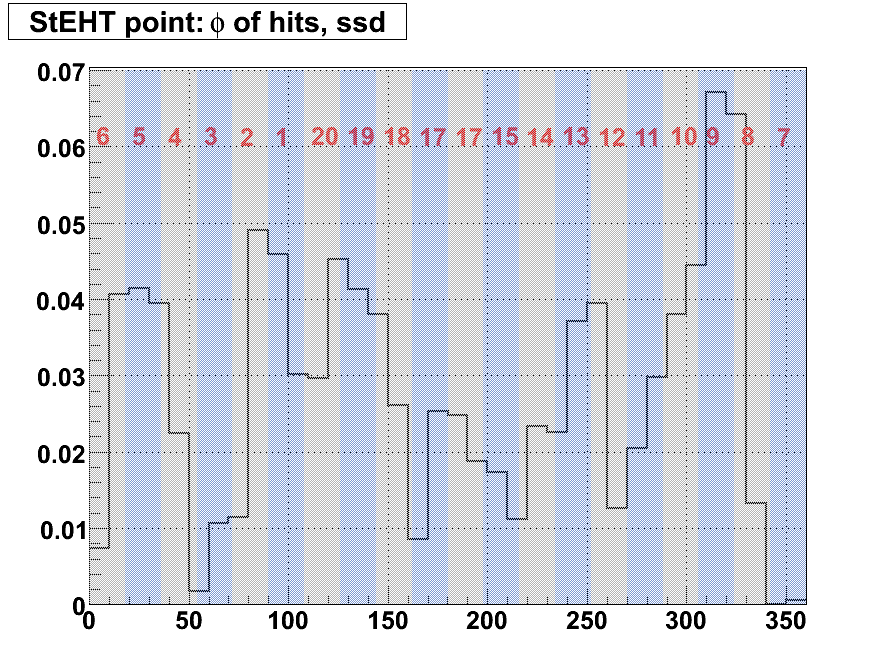
StE*QaPointPhiSSD[2] &phi Distribution of hits [2] The same as above but normalized and with the label of each ladder. (shaded boxes are roughly to indicate the range of the ladder in &phi) |
|
|
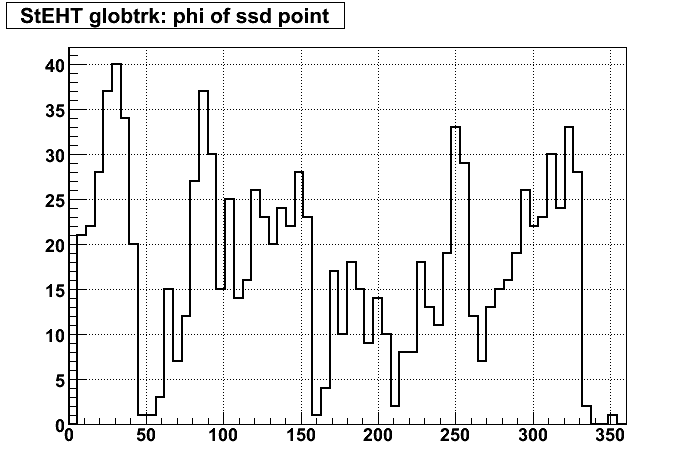
StE*QaGtrkPhifSSD &phi of globals tracks with a ssd point fitted We select 'good tracks'(roughly in the SSD acceptance) and with a minimum of points in TPC to evaluate this effiency:
|
|
|
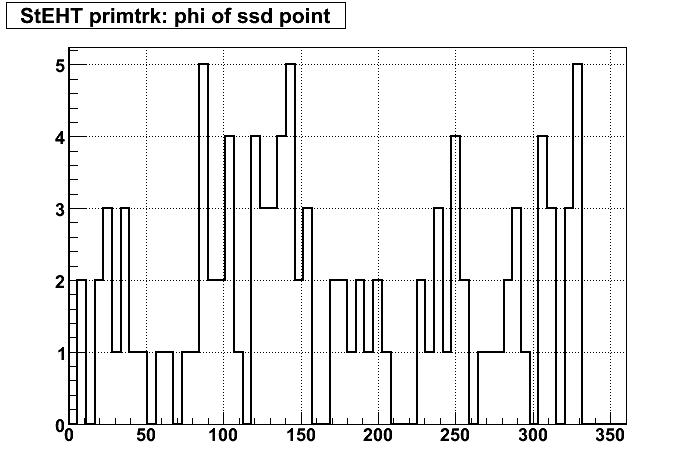
StE*QaPtrkPhifSSD &phi Distribution of primary tracks Same conditions than the globals tracks. |
|
 Jonathan.Bouchet