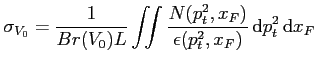
The production cross section for  particles in the acceptance of the HERA-B
detector can be expressed as follows:
particles in the acceptance of the HERA-B
detector can be expressed as follows:
 |
(6.19) |
where
 is the number of observed s in bins of
  and
and  and
and
 is the total acceptance which
includes geometrical acceptance of the detector and reconstruction
efficiency (see Section 6.4) for the considered kinematical range.
The branching ratios
is the total acceptance which
includes geometrical acceptance of the detector and reconstruction
efficiency (see Section 6.4) for the considered kinematical range.
The branching ratios  are taken from Ref. [#!Pdg!#] , and
 is the luminosity which has been calculated for each wire separately, as it
is described in 6.5.
is the luminosity which has been calculated for each wire separately, as it
is described in 6.5.
The inclusive differential cross section per nucleon
 for various targets and target materials are shown in Table
6.4 for the range [-0.12,0]. The inclusive differential cross section
per nucleon
for various targets and target
materials are shown in Table 6.5 for the positive range.
for various targets and target materials are shown in Table
6.4 for the range [-0.12,0]. The inclusive differential cross section
per nucleon
for various targets and target
materials are shown in Table 6.5 for the positive range.
Table 6.5:
The inclusive differential production cross section
in  for
for
 and
and
 particles measured on three different
targets for positive range.
particles measured on three different
targets for positive range.
 |
C |
Ti |
W |
 |
| 0. - 0.015 |
665.3  7.5 133.1 7.5 133.1 |
3056.5 41.8 611.3 |
7850.4 71.7 1570.1 |
| 0.015 - 0.03 |
648.3 14.5 129.7 |
2878.1 78.9 575.6 |
7439.9 137.2 1487.8 |
| 0.03 - 0.045 |
665.9 33.1 133.2 |
2773.3 177.6 554.6 |
6757.9 289.9 1351.6 |
| 0.045 - 0.06 |
626.8 65.2 125.4 |
3387.6 554.7 677.5 |
8482.1 861.5 1696.4 |
 |
| 0. - 0.015 |
171.2 8.3 34.2 |
1149.3 78.1 229.8 |
2595.1 102.4 519.2 |
| 0.015 - 0.03 |
236.2 19.6 47.2 |
1217.6 131.8 243.5 |
2947.2 188.3 589.4 |
| 0.03 - 0.045 |
269.5 44.5 53.9 |
1327.1 257.6 265.4 |
4412.2 588.2 882.4 |
|
|
| 0. - 0.015 |
108.1 6.4 21.6 |
533.3 41.1 106.6 |
1345.9 67.1 269.2 |
| 0.015 - 0.03 |
111.5 11.4 22.3 |
646.1 87.3 129.2 |
1352.9 112.7 270.6 |
| 0.03 - 0.045 |
105.5 17.9 21.1 |
917.5 277.4 183.5 |
2263.7 420.2 452.7 |
|
In order to be comparable with results from other experiments
the obtained cross sections have to be extrapolated to the full
range [-1.,1.]. The extrapolation was based on the measurements in the negative region
by using the parameterization
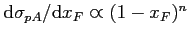 [#!brod!#].
The parameter
[#!brod!#].
The parameter  is constant and values for different strange particles
are taken from the measurements of inclusive strange-particle production
done by other experiments [#!Adam!#]. The resulting production cross
sections
is constant and values for different strange particles
are taken from the measurements of inclusive strange-particle production
done by other experiments [#!Adam!#]. The resulting production cross
sections
 for are listed in Table 6.4.
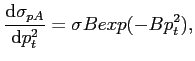
The differential cross sections
 are listed in Table 6.7. The results are plotted in Fig.
6.18, fits are done by the function
are listed in Table 6.7. The results are plotted in Fig.
6.18, fits are done by the function
 |
(6.20) |
where B is a parameter independent from and [#!zavm!#].
Measured parameter B for different target materials are listed in Table 6.6.
The measured spectra is well described by the Eq. 6.20.
Table 6.6:
The values of the parameter B obtained by
fitting the differential cross section.
 |
| |
C |
Ti |
W |
|
3.3 0.3 |
3.1 0.3 |
3.1 0.3 |
|
2.1 0.2 |
2. 0.3 |
2.0 0.2 |
|
|
2.3 0.2 |
2.1 0.2 |
2.1 0.2 |
|
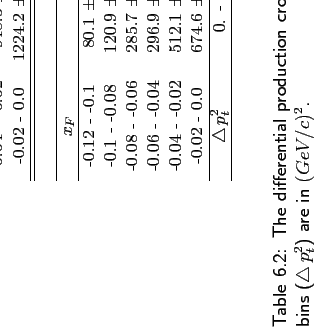
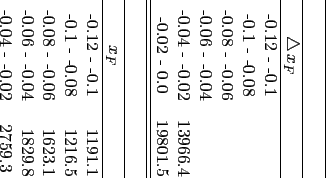
The differential production cross sections
 are listed in
Table 6.8-6.10. Only statistical errors are quoted here.
are listed in
Table 6.8-6.10. Only statistical errors are quoted here.
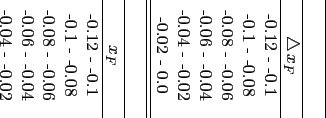
Table 6.7:
The inclusive differential production cross section
in
 for
and
particles measured on three different
targets. The bins (
for
and
particles measured on three different
targets. The bins (
 ) are in
  .
.
|
|
C |
Ti |
W |
|
| 0. - 0.2 |
327.1 16.6 55.6 |
1549.5 79.3 263.4 |
4042.8 204.4 687.2 |
| 0.2 - 0.4 |
121.2 6.2 20.6 |
580.7 30.2 98.7 |
1542.1 78.6 262.1 |
| 0.4 - 0.6 |
56. 2.9 9.5 |
281.2 15.2 47.8 |
743.8 38.5 126.4 |
| 0.6 - 0.8 |
29.5 1.6 5. |
146.5 8.3 24.9 |
415.1 22. 70.5 |
| 0.8 - 1.0 |
18.2 1.1 3.1 |
93.3 5.8 15.8 |
253.3 14. 43.01 |
| 1.0 - 1.2 |
11.1 0.7 1.8 |
67.7 4.9 11.5 |
169.7 9.9 28.8 |
|
| 0. - 0.2 |
81.2 4.5 13.7 |
494.9 28.1 84.1 |
919.7 48.7 156.3 |
| 0.2 - 0.4 |
50.6 2.8 8.6 |
296.7 17.1 50.4 |
577.9 30.7 98.2 |
| 0.4 - 0.6 |
32.7 1.9 5.5 |
179.1 11.2 30.4 |
430.8 23.9 73.2 |
| 0.6 - 0.8 |
20.7 1.4 3.5 |
114.7 8.1 19.5 |
269.1 15.9 45.7 |
| 0.8 - 1.0 |
14.8 1.1 2.5 |
90.1 8. 15.3 |
221.7 14.6 37.7 |
| 1.0 - 1.2 |
12.3 1.2 2.1 |
77.1 8.8 13.1 |
142.6 10.7 24.2 |
|
|
| 0. - 0.2 |
25.1 1.5 4.2 |
118.2 7.2 20.1 |
317.2 17.6 53.9 |
| 0.2 - 0.4 |
16.1 0.9 2.7 |
79.6 4.9 13.5 |
200.2 11.1 34. |
| 0.4 - 0.6 |
9.7 0.6 1.6 |
51.3 3.5 8.7 |
126.6 7.4 21.5 |
| 0.6 - 0.8 |
6.1 0.4 1. |
27.5 2.2 4.6 |
87.6 5.6 14.8 |
| 0.8 - 1.0 |
3.5 0.3 0.5 |
19.9 2.1 3.3 |
56.7 4.1 9.6 |
| 1.0 - 1.2 |
2.6 0.2 0.4 |
19.1 2.6 3.2 |
36.8 3.1 6.2 |
|
Figure 6.18:
The differential production cross sections
for for three target materials
(Carbon, Titanium and Tungsten).
|
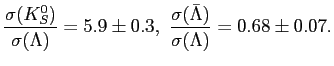
The ratios of production cross sections from the measurements listed
above for mid-rapidity for Carbon wire are
Fig. 6.19 shows the ratios for all three different target materials used.
Figure:
The ratio of
 determined at mid-rapidity for the used targets.
|
The dependences of production cross sections on the atomic number
of the target material are shown in Fig. 6.20 and fitted by the
 .
Production cross sections and
.
Production cross sections and  obtained from the fit
are listed in Table 6.11.
obtained from the fit
are listed in Table 6.11.
Figure 6.20:
The total production cross section as a function of
atomic mass A of the target material. The solid lines show fits by the
 function.
|
Table 6.11:
Production cross section per nucleon for and
results of the dependences of production cross sections on the atomic number.
| |
|
|
|
 (mb) (mb) |
13.2 0.91 2.3 |
6.5 0.57 0.94 |
1.6 0.17 0.28 |
|
0.961 0.026 |
0.927 0.021 |
0.93378 0.026 |
|
The production cross sections per nucleon as a function of the atomic number
of the target material are shown in Fig. 6.21
Figure 6.21:
The total production cross section per nucleon
as a function of atomic mass A of the target material.
|
Subsections
Yury Gorbunov
2010-10-21