The left and right halves of the Si detector had
different number of working channels:
225 on the left side, 245 on the right, out of 256 on either side in total.
In the analysis, a ![]() -free side of the detector is used for each sign.
This is the ``left'' (Saleve) side for the positive, and ``right'' (Jura) side
for the negative settings.
After the radiation damage correction (Table 4.4) is applied, a comparison
of the so corrected multiplicities, measured in the samples of identical centrality
by the left and right parts of the detector,
is performed to test the quality of the multiplicity measurement.
In all cases we look at
-free side of the detector is used for each sign.
This is the ``left'' (Saleve) side for the positive, and ``right'' (Jura) side
for the negative settings.
After the radiation damage correction (Table 4.4) is applied, a comparison
of the so corrected multiplicities, measured in the samples of identical centrality
by the left and right parts of the detector,
is performed to test the quality of the multiplicity measurement.
In all cases we look at ![]() -free side, so it takes a change in the sign of
magnetic field to compare the two sides.
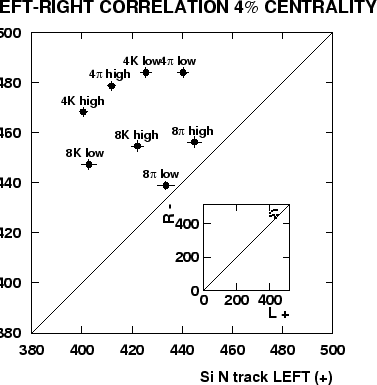
Fig. 4.7 shows the comparison where each point represents
a particular setting of the Cherenkov trigger, angle and magnetic field strength.
The abscissa and the ordinate represent average multiplicity of charged tracks,
measured in the 4% centrality sample, in the positive and negative runs respectively,
by one half of the detector.
Corrections for the dead pads (=
-free side, so it takes a change in the sign of
magnetic field to compare the two sides.
Fig. 4.7 shows the comparison where each point represents
a particular setting of the Cherenkov trigger, angle and magnetic field strength.
The abscissa and the ordinate represent average multiplicity of charged tracks,
measured in the 4% centrality sample, in the positive and negative runs respectively,
by one half of the detector.
Corrections for the dead pads (=
![]() are applied.
are applied.
 |
The estimate of the systematic uncertainty in the centrality determination
is based on the following considerations.
Once the set of T0 thresholds at fixed centralities is
established for every physics setting,
a comparison of the Si multiplicities
between different runs can be performed for every centrality bin.
The variance of the Si multiplicity ![]() between different
run periods (at fixed centrality) characterizes the uncertainty of
the absolute normalization.
The fractional error bar of
between different
run periods (at fixed centrality) characterizes the uncertainty of
the absolute normalization.
The fractional error bar of ![]() is
slightly better for high centrality points in agreement with my
intuitive view that
selection of high multiplicity samples and measurements of high
multiplicity should be more reliable, because statistical fluctuation
of a larger number is relatively smaller.
For the interesting range of centralities (
is
slightly better for high centrality points in agreement with my
intuitive view that
selection of high multiplicity samples and measurements of high
multiplicity should be more reliable, because statistical fluctuation
of a larger number is relatively smaller.
For the interesting range of centralities (![]() ) the
) the
![]() .
For kaons, because the Si is
involved twice, I multiply the above mentioned centrality
uncertainty by
.
For kaons, because the Si is
involved twice, I multiply the above mentioned centrality
uncertainty by ![]() .
Table 4.5 summarizes the centralities.
.
Table 4.5 summarizes the centralities.
The advantage of this method of normalization
is that it utilizes the Si multiplicity
to solve the problem of normalization which is otherwise difficult
to solve without making ungrounded assumptions, idealizing
the experiment,
e.g. the assumption that the top ![]() % of T0 amplitudes
are the top
% of T0 amplitudes
are the top ![]() % of the most central events, or that requirement of
a spectrometer track in the trigger (with the ``jaws'' !)
makes no effect on the centrality of
the data sample so selected.
% of the most central events, or that requirement of
a spectrometer track in the trigger (with the ``jaws'' !)
makes no effect on the centrality of
the data sample so selected.
I have used RQMD simulation to link the acceptances of Si and
spectrometer.
I believe that any other normalization technique
using T0 would, too, need simulations
to fully understand the shape of minimum bias distribution in T0,
and the effect of the spectrometer requirement in order to determine
the trigger performance
to the degree of realism needed for absolute normalization at the 6-8 %
systematic error level.
My approach reduces the simulation problem to
the one which is quite tractable and relies on RQMD features not more
sophisticated than the gross shape of
![]() distribution.
distribution.