


Next: Results, systematic uncertainties, and
Up: Determination of the trigger
Previous: Runs with Cherenkov veto
Contents
Kopytine's homepage
Correction for the consequences of radiation damage in Si
Radiation damage in Si detectors is known [42] to result in
- an increase in dark current due to damage to the bulk Si
- a decrease in the collected charge signal due to charge trapping
Both effects make discrimination of particle
track signals against the noise and dark current background more
difficult.
Technically, the problem shows up in the number
of hits with signal above the
threshold, not associated with particle
tracks. These ``fake hits'' affect the
multiplicity measurement. The effect calls for
evaluation and correction.
The correction algorithm (to be described below) deconvolutes the real distribution
from the real+noise by sampling events according to the measured distributions
of real+noise and noise, and consists of the following steps:
- In the valid beam run, a sample of ``pure noise'' Si events was selected by
cuts on all T0 tubes, combined with a 2D cut on the Si amplitude sum vs Si
number of hits, using both sides of the Si detector and vetoing Si events
with large total amplitude (but not with large number of hits !). Thus the
distribution of the number of hit Si pads (delta-free part only) in these
``pure noise'' events was sampled. It is an asymmetric distribution with
maximum around 10 and a mean between 20 and 40, depending on the quality of
the detector's performance.
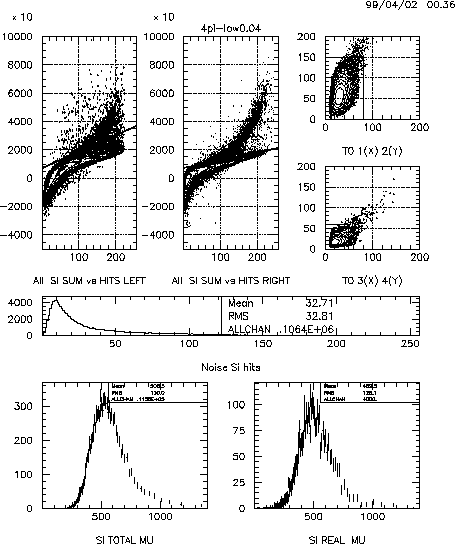
(An example can be found in Fig. 4.6, the middle panel,
``Noise Si hits''.)
The asymmetry points to a ``collective'' nature of
the effect responsible for the fake hits - in accordance with the features
of the physics mechanism just discussed.
- Knowing the ``pure noise'' distribution, and the ``real+noise'' distribution of
the Si hits in the central trigger run, it is possible to reconstruct the
``real'' distribution, because the two known pieces of information determine it
uniquely. The following ``random purification'' algorithm has been
constructed:
- Transform the ``real+noise'' and ``real'' distributions into the Poissonian
variable
 which characterizes multiplicity of tracks. Derive the
correction factor,
which characterizes multiplicity of tracks. Derive the
correction factor,
Figure 4.6:
Illustration of the Si radiation damage correction algorithm in case
of the 4GeV negative low angle setting, 4% centrality sample.
From left to right, from top to bottom: SI ADC sum vs number of hits
for the left and right parts of the detector in the valid beam run, with the
non-interaction
cut shown by the solid line; non-interaction cut on T0 signals in
the valid beam run ; distribution of the number of Si noise hits
in the valid beam run with the non-interaction cut; the ``dirty'' number of charged
tracks
in the physics run; the ``purified'' number of charged tracks.
See text of Subsection 4.2.9
 |
- Apply the correction directly to

This ends the description of the correction method.
Application of the method is illustrated by Fig. 4.6.
![[*]](file:/usr/local/lib/latex2html/icons/footnote.gif)
Table 4.4 gives the summary of corrections for all settings used in
the analysis. The error bars on the correction factors were derived from the
scatter of correction factors determined in 3 independent ``random purification''
runs, 1000 successful events each.
Table:
Radiation damage correction. The factors listed here are applied
directly to .
| Setting |
4% centr. |
10% centr |
Setting |
4% centr. |
10% centr |
| 4k-low |
0.91  0.013 0.013 |
0.902 0.011 |
4k+low |
0.873 0.002 |
0.864 0.007 |
| 4k-high |
0.943 0.004 |
0.951 0.011 |
4k+high |
0.935 0.008 |
0.931 0.010 |
4 low low |
0.92 0.01 |
0.921 0.007 |
4 low low |
0.89 0.02 |
0.876 0.005 |
| 4high |
0.947 0.002 |
0.934 0.003 |
4high |
0.937 0.01 |
0.934 0.003 |
| 8k-low |
0.955 0.004 |
0.955 0.002 |
8k+low |
0.879 0.013 |
0.879 0.010 |
| 8k-high |
0.930 0.003 |
0.926 0.006 |
8k+high |
0.938 0.005 |
0.947 0.007 |
| 8low |
0.956 0.008 |
0.948 0.009 |
8low |
0.88 0.016 |
0.872 0.009 |
| 8high |
0.939 0.008 |
0.9333 0.0004 |
8high |
0.930 0.013 |
0.931 0.007 |
|
Conclusions from the table:
-
Si in the the high angle setting performs better. This is natural, given the
radiation damage mechanism of the problem,
and the fact that the high angle
setting was used earlier in the run.
-
As a general trend, the larger multiplicity bin (4%) needs less of a
correction. This is because more real multiplicity leaves less room
for the fake hits to contaminate the picture.
Next: Results, systematic uncertainties, and
Up: Determination of the trigger
Previous: Runs with Cherenkov veto
Contents
Mikhail Kopytine
2001-08-09