


Next: Summary of the systematic
Up: Kaon identification
Previous: Time of flight in
Contents
Kopytine's homepage
At this point we turn again to the figures (Fig. 3.4 and
Fig. 3.5) that illustrate the difference in the approaches
to kaon identification in different spectrometer settings.
As was already discussed in Section 3.4, a Cherenkov veto
( ) was
used to obtain kaon-enhanced data samples.
The price of the high cleanliness of a PID with is its high
inefficiency: any event resulting in a firing of the vetoing Chereknov's
counter (a passage of any charged particle of sufficient velocity through
the counter's aperture) may result in a loss of a kaon.
In particular, such can be the outcome of a coincidence of the kaon
with a pion or an electron in the counter's acceptance.
To evaluate this inefficiency, we take the following steps:
) was
used to obtain kaon-enhanced data samples.
The price of the high cleanliness of a PID with is its high
inefficiency: any event resulting in a firing of the vetoing Chereknov's
counter (a passage of any charged particle of sufficient velocity through
the counter's aperture) may result in a loss of a kaon.
In particular, such can be the outcome of a coincidence of the kaon
with a pion or an electron in the counter's acceptance.
To evaluate this inefficiency, we take the following steps:
- On-line: obtain a sample without the veto and a sufficient
statistics of kaons.
- Off-line: in the sample without veto, find a way of
counting
![[*]](file:/usr/local/lib/latex2html/icons/footnote.gif) the kaons with and (non-trivial !) without the veto.
the kaons with and (non-trivial !) without the veto.
The counting of the rejected kaons can be possible in presense of
a device sensitive to the difference between kaons and lighter particles.
Presense of a device capable of identifying kaons independently
of the Cherenkovs is ideal.
Such an ideal case is realized in the weak magnetic field setting,
(see Fig. 3.4) where
the  measurement (due to the good time-of-flight resolution) allows
one to tell kaons from lighter particles even in the absence of the veto.
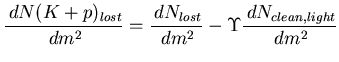
The inefficiency correction factor is therefore easily calculable:
measurement (due to the good time-of-flight resolution) allows
one to tell kaons from lighter particles even in the absence of the veto.
The inefficiency correction factor is therefore easily calculable:
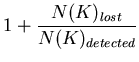 |
(32) |
The case of a strong field setting (see Fig. 3.5) is complicated
by the fact that a particle lost due to the veto is not necessarily a kaon,
but a kaon or a lighter particle.
The lighter particle is most likely a pion and will be called so in the
following discussion.
Figure:
Correcting for the Cherenkov veto inefficiency in the
strong field case, 4% most central events.
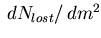
The number of rejected kaons is evaluated by subtracting
the clean pion line shape scaled by a proper multiplier  .
+ = all vetoed tracks
.
+ = all vetoed tracks
 ;
;
 = ratio of the pure pion line
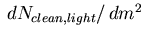 to the ``all vetoed tracks'' distribution,
  (also in the insert) =
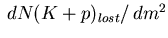 obtained as ``all vetoed tracks''
minus - scaled pion line
(see Eq. 4.31).
The shaded histogram shows the distribution of
obtained as ``all vetoed tracks''
minus - scaled pion line
(see Eq. 4.31).
The shaded histogram shows the distribution of  tracks which were
not vetoed.
tracks which were
not vetoed.
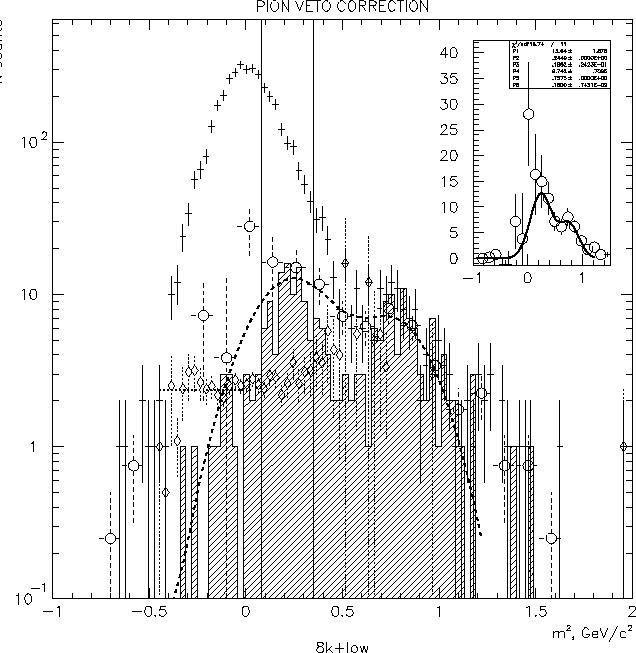 |
It is possible to count the lost kaons without identifying them,
taking advantage of the fact that the kaon and pion peaks in the spectrum
of vetoed tracks (see Fig. 4.10) are separated, even though
they overlap.
In order to subtract the pions from all vetoed tracks, we select a clean sample
of undoubtedly light tracks ( +
+ )
from a sample of good events with a single hit in
hodoscopes
)
from a sample of good events with a single hit in
hodoscopes  and
and  and only one reconstructed track, by requiring a large
(characteristic of a pion) signal in
and only one reconstructed track, by requiring a large
(characteristic of a pion) signal in  .
Since this requirement is highly selective, we use the shape of the distribution
so obtained, but not the magnitude of the probability it represents.
Therefore, we seek a multiplier that allows us to subtract
the light particle distribution without remainder to obtain the number of
the vetoed
.
Since this requirement is highly selective, we use the shape of the distribution
so obtained, but not the magnitude of the probability it represents.
Therefore, we seek a multiplier that allows us to subtract
the light particle distribution without remainder to obtain the number of
the vetoed  and
and  only.
We do it by dividing the ``
only.
We do it by dividing the `` '' histogram on Fig. 4.10 by the
clean light track distribution (not shown).
Flatness of the ratio so obtained (shown as ) is to be expected
in the range of where the light particle line shape selected is
representative of the sample we want to subtract.
We fit the ratio in the flat region to obtain the required multiplier
, and subtract the light particle line shape:
'' histogram on Fig. 4.10 by the
clean light track distribution (not shown).
Flatness of the ratio so obtained (shown as ) is to be expected
in the range of where the light particle line shape selected is
representative of the sample we want to subtract.
We fit the ratio in the flat region to obtain the required multiplier
, and subtract the light particle line shape:
 |
(33) |
The histogram plotted on Fig. 4.10
by represents the distribution of vetoed and only,
.
To get
 , we pick an window (vertical lines
on Fig. 4.10).
By solving the standard problem of interpreting a sum of two Gaussian peaks
as ``signal'' + ``background'', being the signal and the background,
one finds that the ``lost'' kaons in the window are 98-99% clean of protons.
, we pick an window (vertical lines
on Fig. 4.10).
By solving the standard problem of interpreting a sum of two Gaussian peaks
as ``signal'' + ``background'', being the signal and the background,
one finds that the ``lost'' kaons in the window are 98-99% clean of protons.
Next: Summary of the systematic
Up: Kaon identification
Previous: Time of flight in
Contents
Mikhail Kopytine
2001-08-09